Band 5.5 IELTS Writing Task 1 Model Answer
Overall Band Score: 5.5 · IELTS Complete Catalyst · 2026-11-17
IELTS Writing Task 1 question
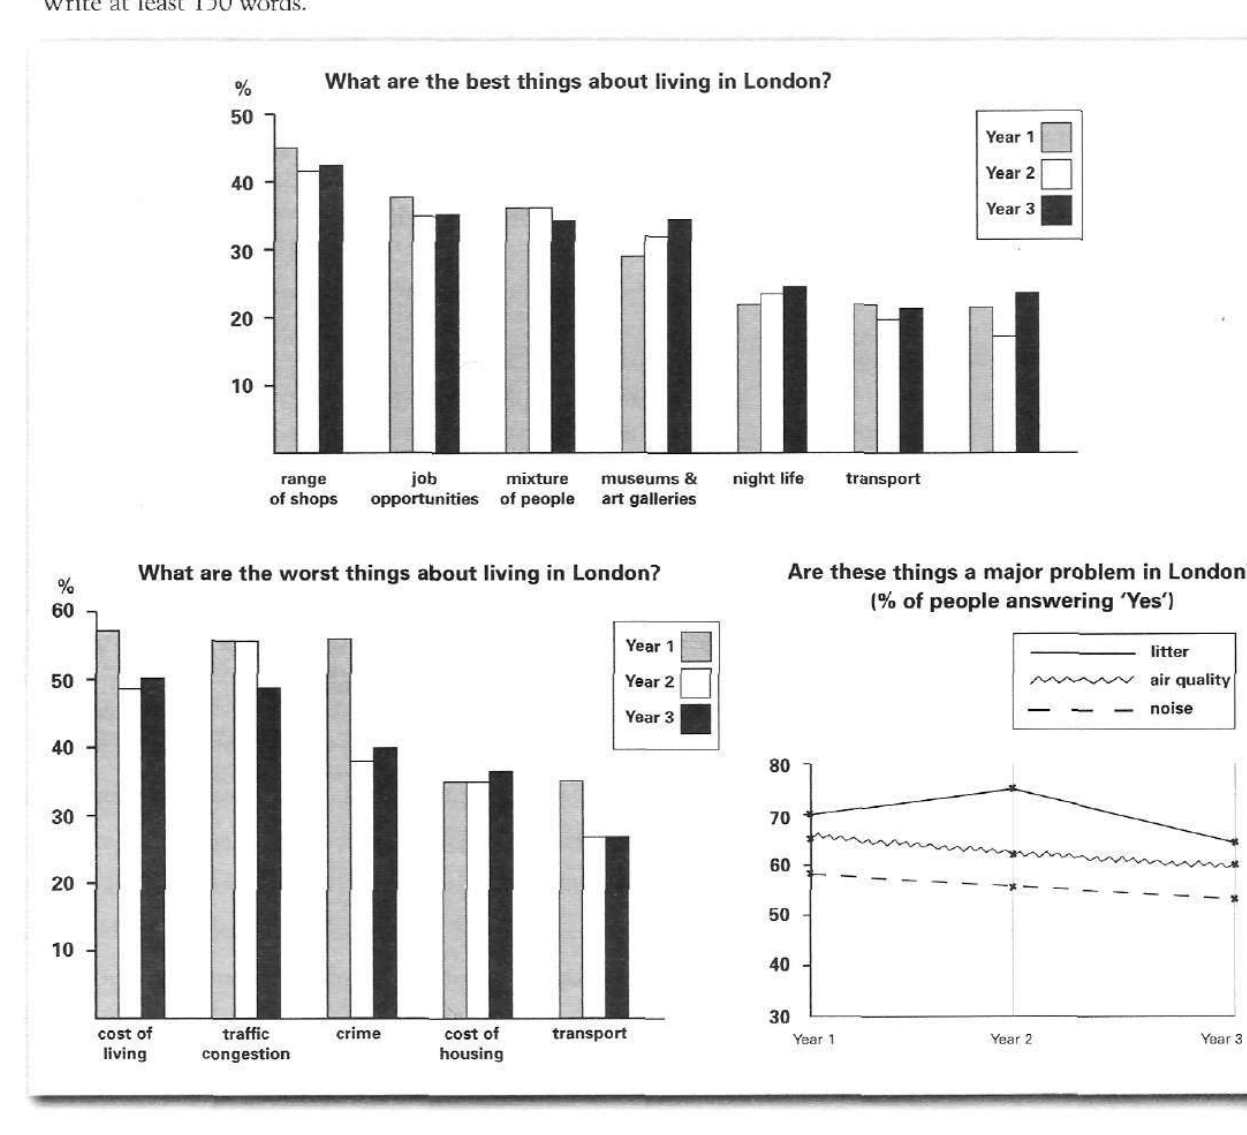
The bar charts and line graph below show the results of a survey conducted over a three-year period to discover what people who live in London think of the city.
Write a report for a university lecturer describing the information below.
What are the best things about living in London?
Student answer (Band 5.5)
The bar charts describe a survey result that conducted over a number of people ( in percentage) about what are the best and worst things to live in London city. The line graph also illustrates about the major problem on living in London city over a three year period.
Overall , in the bar graphs, most of the city dweller think the best things about living in the city is that there are many ranges of shops and they think shopping is the best thing about this city over the three year suvery result. On the other hand in first year survey, most of the london residents believes crime and cost of living are the worst things in the city. From the table, major problem of the city is litter as over the year the problem is decreasing.
By looking at the bar graphs, 45% of people in london thinks that the varities of shops are great in london and there is no major change in this opinion over the three years. Same trend happens to job oportuniies and mixture of people as about 40% and 38% people think these are the best things in london over the three years, There is a flactuating opinion on mueseums , night life and transport as people opinion in these things chnage over the year. According to the second graph, people think the worst things in london are cost of living ,traffic congestion and crime as about 60% believes this.
In terms of table, the major problem is litter as iniltially it was 70% people thinks like that but it peaked to 80% and air quality and noise level
AI examiner evaluation
| Criterion | Band |
|---|---|
| Task Achievement / Task Response | 5.5 |
| Coherence and Cohesion | 5.0 |
| Lexical Resource | 5.5 |
| Grammatical Range and Accuracy | 5.0 |
| Overall | 5.5 |
Task Achievement / Task Response: Band 5.5
You identify the charts’ main subject and offer an overview, noting that shops are a leading positive feature and litter is a major problem. However, coverage is partial and some key details are inaccurate or unclear. The first chart’s figures for job opportunities and the mixture of people are closer to 35–38%, not consistently “about 40%,” and the second chart does not show crime and cost of living as the top concerns in every year: traffic congestion is highest in Year 2. The final paragraph is unfinished, and the claim that litter peaked at 80% conflicts with the chart, where it reaches about 75% in Year 2. Include a complete comparison of the three problem indicators and report the main changes accurately to develop the response further.
Coherence and Cohesion: Band 5.0
The response has a recognisable structure: an introduction, an overview, and paragraphs addressing the positive and negative features and the problem indicators. This gives the reader some organisation. However, progression is uneven, and the final paragraph stops mid-sentence after “air quality and noise level,” leaving the last comparison incomplete. Connections between ideas are sometimes unclear: “Same trend happens” does not explain which trend is shared, while “There is a fluctuating opinion” is not followed by specific comparisons. Linking phrases such as “Overall,” “On the other hand,” and “In terms of” are useful, but they cannot replace clear sequencing of the data. Group the charts systematically and use explicit comparisons between years so each paragraph develops a complete point.
Lexical Resource: Band 5.5
You use some relevant vocabulary for describing survey data, including “percentage,” “major problem,” “decreasing,” and “fluctuating.” These choices show an attempt to discuss trends rather than simply list categories. However, the range is limited and several word-choice, collocation, and spelling errors make parts difficult to interpret, such as “a survey result that conducted,” “varities,” “oportuniies,” and “iniltially.” Phrases such as “best things to live in London city” are also awkward for this report. Aim for accurate, natural expressions such as “respondents identified,” “the proportion remained broadly stable,” and “the most frequently cited drawback.” Proofreading spelling and choosing precise chart-reporting vocabulary would make your descriptions clearer.
Grammatical Range and Accuracy: Band 5.0
You attempt both simple and longer sentences, and the response is generally recognisable despite grammatical problems. However, complex sentences are often faulty, and errors in agreement, verb forms, articles, and sentence construction recur. For example, “most of the city dweller think” needs plural agreement, while “45% of people in london thinks” also mismatches the plural subject and verb. The opening phrase “a survey result that conducted” lacks a correctly formed passive construction, and “most of the london residents believes” has the same agreement problem. Punctuation and sentence boundaries also need attention, particularly where a comma joins long clauses. Practise building accurate sentences with “the survey was conducted” and “the proportion of residents who considered…” before adding more complex clauses.
See this exact question answered at other band scores. The same prompt compared across bands.
Browse more IELTS Writing model answers or get your own writing scored by the same AI examiner.