Band 5.0 IELTS Writing Task 1 Model Answer
Overall Band Score: 5.0 · IELTS Complete Catalyst · 2026-11-17
IELTS Writing Task 1 question
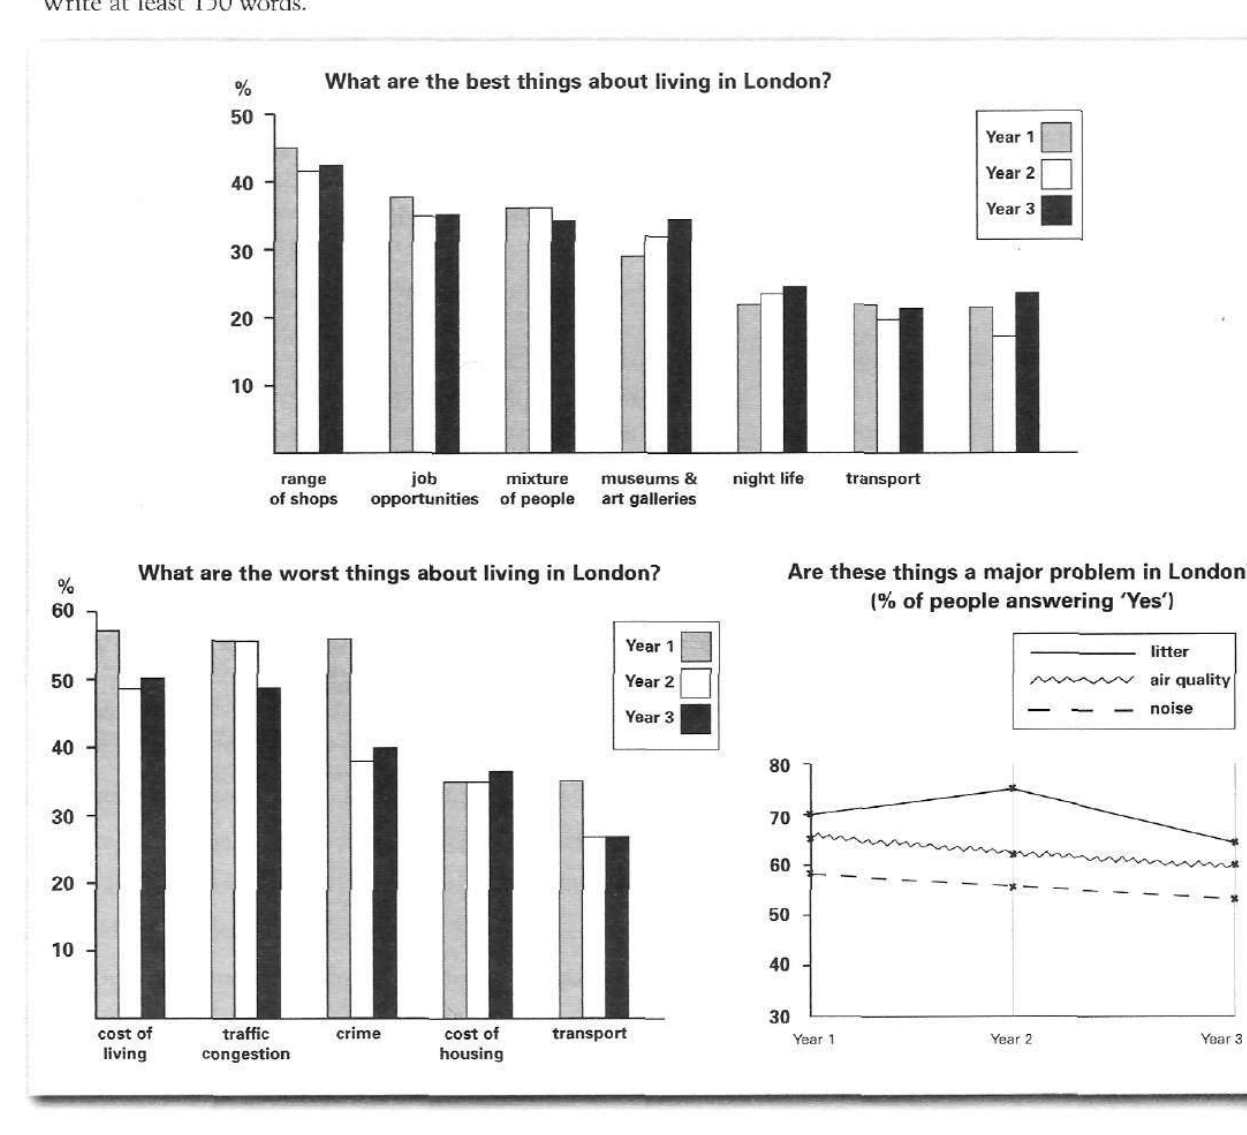
The bar charts and line graph below show the results of a survey conducted over a three-year period to discover what people who live in London think of the city.
Write a report for a university lecturer describing the information below.
What are the best things about living in London?
Student answer (Band 5.0)
Firstly we have information all about london like range of shop,job opportunities,mixture of people,museums and art galleries,night life
and transport.We are comparing the life of year 1,year 2 and year 3
The best thing about living in london on year 1 is range of shops which is almost about 45%.There are variety of shops for public and local so they go and purchase whatever they want.They have facilities at their doorstep.
These figures slightly decrease in year 2 which is about 42%.Although this is not the bigger changel.The best thing in london is still the same.In year 3 this figures slightly changed about 43%.
However job opportunities,mixture of people,museums & art galleries,night life the interest of people is lower than the range of shops and lower n lower in the three consecutive years.
The worst things about living in london is cost of living,traffic congestion and crime also.As we compare the values over time.Cost of living is about 57%
on year 1 is the most higher.Traffic congestion is about 55% which is same in Year 1 and Year 2.The crime rate is about 56% which is higher than the traffic congestion.
If we focus on three elements like litter,air and noise in the london.The most concerening is litter which is about 75%.Air quality also decreasing like 65% to lower over the period of time.c
AI examiner evaluation
| Criterion | Band |
|---|---|
| Task Achievement / Task Response | 5.0 |
| Coherence and Cohesion | 5.0 |
| Lexical Resource | 5.0 |
| Grammatical Range and Accuracy | 5.0 |
| Overall | 5.0 |
Task Achievement / Task Response: Band 5.0
You identify several relevant features, including the range of shops as the leading positive feature in Year 1 and litter as a major concern. However, the report only partially covers the charts and lacks a clear overview of the main patterns. Some figures are inaccurate: the shops figure is about 41.5% in Year 2 and 42.5% in Year 3, while you give approximately 42% and 43%; these are small differences, but the larger issue is that the final paragraph misstates air quality, which falls from about 66% to 60%, not from 65% to a lower unspecified value. You also say traffic congestion is unchanged in Years 1 and 2, but it is about 55.5% in both, and omit the Year 3 decline. Summarise the overall trends and compare key categories across all three years.
Coherence and Cohesion: Band 5.0
The response has some paragraphing and a broadly understandable order: positive features are discussed before negative ones, followed by the problem indicators. This gives the reader a basic sense of organisation. However, there is no clear overall progression from an overview to selected comparisons, and several points are presented as disconnected statements. For example, “However job opportunities, mixture of people…” introduces a list without explaining how their figures change, while “As we compare the values over time” does not lead into a complete comparison. Linking phrases such as “Firstly,” “However,” and “If we focus” are used, but connections are sometimes mechanical or unclear. Add a concise overview after the introduction, then group related comparisons and use clear references to the years and categories.
Lexical Resource: Band 5.0
You use enough topic vocabulary to identify the chart categories, including “range of shops,” “job opportunities,” “traffic congestion,” and “air quality.” This makes the subject generally clear. However, the vocabulary range is limited and several noticeable word-choice, collocation, and spelling errors make parts awkward or difficult to interpret. Examples include “the interest of people,” “the most higher,” “concerening,” and “lower n lower.” Some phrases are also imprecise, such as “three elements like litter, air and noise,” where the chart refers specifically to air quality. Aim for accurate reporting language and vary expressions for change and comparison, such as “remained stable,” “declined,” and “was the highest.”
Grammatical Range and Accuracy: Band 5.0
The response attempts some longer sentence forms, including “Although this is not the bigger changel” and “As we compare the values over time,” but most sentences rely on simple patterns, and attempts at more complex structures are often faulty. Errors in articles, agreement, tense, and sentence construction occur frequently: “The best thing … on year 1 is range of shops,” “These figures slightly decrease in year 2,” and “The worst things … is cost of living.” Some sentence fragments also interrupt the flow, such as “As we compare the values over time.” Punctuation and capitalisation are inconsistent, particularly around year labels. Practise accurate comparative sentences and use a consistent past tense when describing the survey results.
See this exact question answered at other band scores. The same prompt compared across bands.
Browse more IELTS Writing model answers or get your own writing scored by the same AI examiner.