Band 5.0 IELTS Writing Task 1 Model Answer
Overall Band Score: 5.0 · IELTS Complete Catalyst · 2026-11-17
IELTS Writing Task 1 question
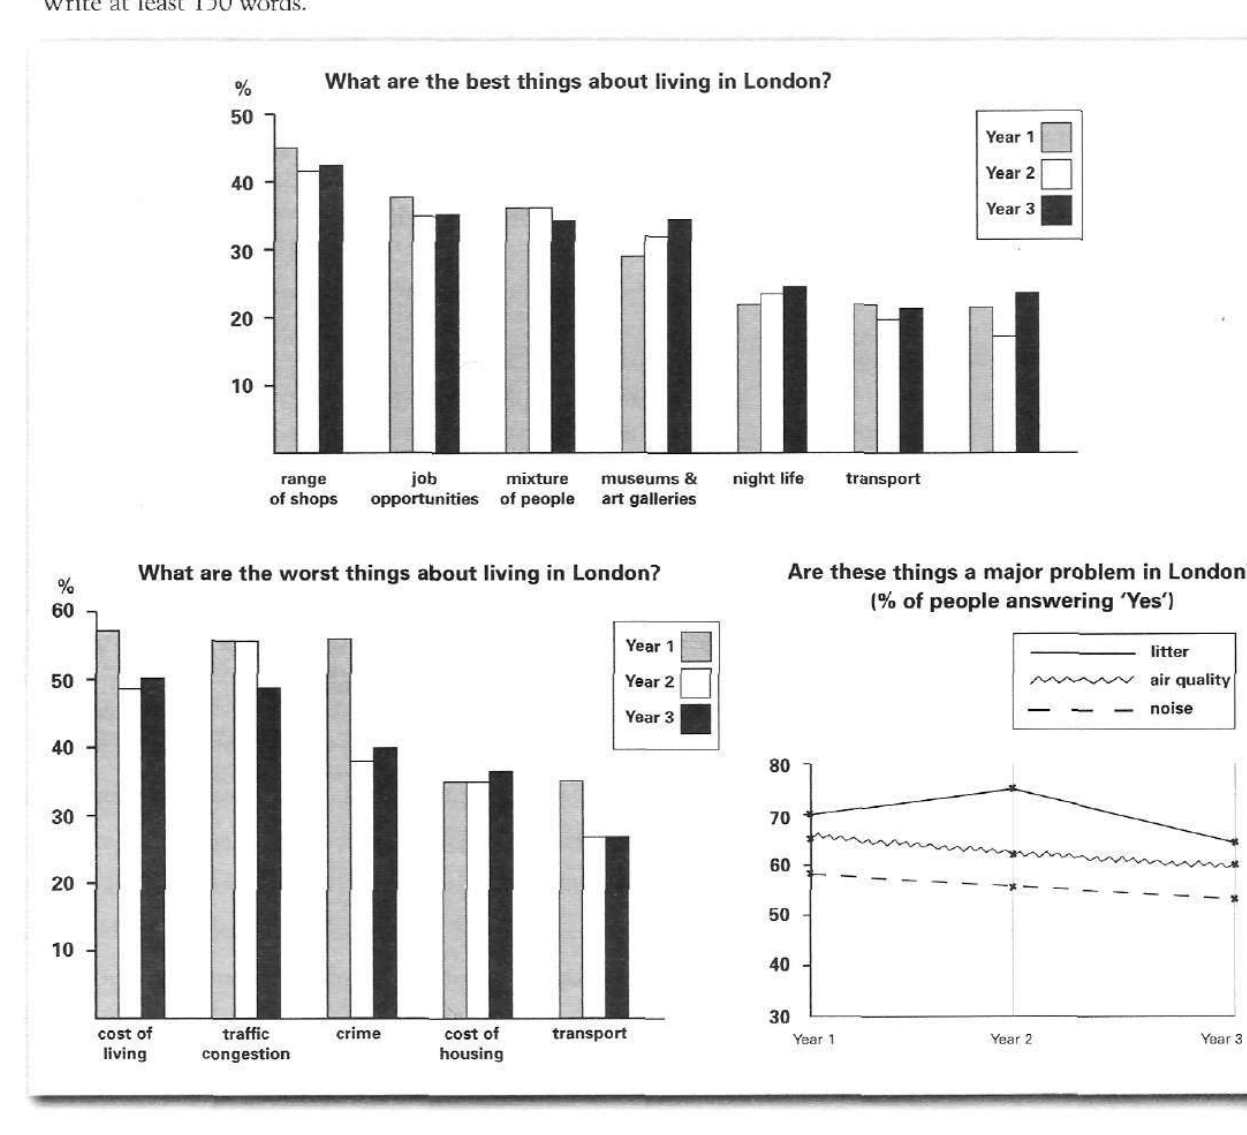
The bar charts and line graph below show the results of a survey conducted over a three-year period to discover what people who live in London think of the city.
Write a report for a university lecturer describing the information below.
What are the best things about living in London?
Student answer (Band 5.0)
"The bar chart illustrates the different cities over three-year. The range of shops in london
was higher 48%in first year,compared to 47% in third year.The job opportunities in london
was higher 38%in first year,compared to 37%in third year.The mixture of people were higher
39%in first year,compared to 38%.The musems and art galleries were lower 30%in first
year,compared to 40%in third year.The night life was lower 29%higher in first year,
compared to 28%in third year.The transport was remained same 20%in first year and third
year.Overall,the range of shops recorded the highest percentage,while transport had the
lowest figure.
Another bar chart shows the worsts of london.The cost of living was higher 60%in first
year,compared to the 50%in third year.The traffic congestion were higher 48%was higher in
first year
compared to the approximately 50%in 3rd year.The crime were higher 60%was higher in first
year compare to the third year.The cost of housing were 38%was lower in first year
as compared to the approximately 40%in third year.Finally,the transport were 39%lower in
first year as compared to the 30%.Overall,the crime had the highest figure and the cost of
recorded the lowest figure.
AI examiner evaluation
| Criterion | Band |
|---|---|
| Task Achievement / Task Response | 4.0 |
| Coherence and Cohesion | 5.5 |
| Lexical Resource | 5.0 |
| Grammatical Range and Accuracy | 5.0 |
| Overall | 5.0 |
Task Achievement / Task Response: Band 4.0
The response identifies several relevant categories and gives an overview that shops had the highest positive rating, but it only reports selected comparisons and omits the entire line graph about litter, air quality and noise. Many figures and trends are also inaccurate: for example, shops were about 45% in Year 1 and 42.5% in Year 3, not 48% and 47%; museums rose from about 29% to 34.5%, rather than 30% to 40%. The claim that transport was the lowest positive feature is not supported by the chart, which includes another category at around 21.5%, 17% and 24%. The overview of the negative features is also unreliable. Cover all three visuals and select accurate key comparisons to address the task more fully.
Coherence and Cohesion: Band 5.5
The response has a basic organisational structure: it discusses positive features first and negative features second, and uses phrases such as “Overall” and “Finally” to signal movement between points. This gives the reader some sense of grouping. However, progression within each paragraph is largely a repetitive list of categories and figures, with little comparison or linking between related trends. The repeated “was higher… compared to…” pattern also makes the report mechanical, and the second paragraph contains an incomplete comparison (“compared to the approximately 50% in 3rd year”) that weakens the flow. Use a clear overview followed by logically grouped details, and connect figures through contrasts and changes over time rather than repeating the same sentence frame.
Lexical Resource: Band 5.0
The response uses enough topic vocabulary to identify several chart categories, including “job opportunities,” “traffic congestion” and “cost of housing.” However, the range is limited and several word choices or forms are inaccurate, sometimes making the intended meaning unclear. Examples include “the worsts of london,” “the musems,” and “the crime were higher.” Phrases such as “was higher” are also repeated where more precise reporting language would help distinguish increases, decreases and comparisons. Improve accuracy in spelling and category names, and use a broader set of chart-reporting expressions, such as “accounted for,” “rose to,” “fell to” and “remained stable.” Avoid describing a value as “higher” when the comparison does not support that direction.
Grammatical Range and Accuracy: Band 5.0
The response mainly relies on short, simple statements and repeated comparison structures, so there is limited grammatical variety. Errors in agreement and verb forms occur frequently, as in “the job opportunities… was higher,” “the mixture of people were higher,” and “the transport was remained same.” Some sentences also combine forms incorrectly, for example “the traffic congestion were higher 48% was higher,” which makes the comparison difficult to follow. Articles, plurals and punctuation are inconsistently controlled, and several clauses lack clear sentence boundaries. Practise accurate simple past reporting structures first, then vary them with controlled clauses such as “while” and “whereas.” Check subject–verb agreement and use one clear verb construction for each comparison.
See this exact question answered at other band scores. The same prompt compared across bands.
Browse more IELTS Writing model answers or get your own writing scored by the same AI examiner.