Band 5.5 IELTS Writing Task 1 Model Answer
Overall Band Score: 5.5 · IELTS Complete Catalyst · 2026-11-18
IELTS Writing Task 1 question
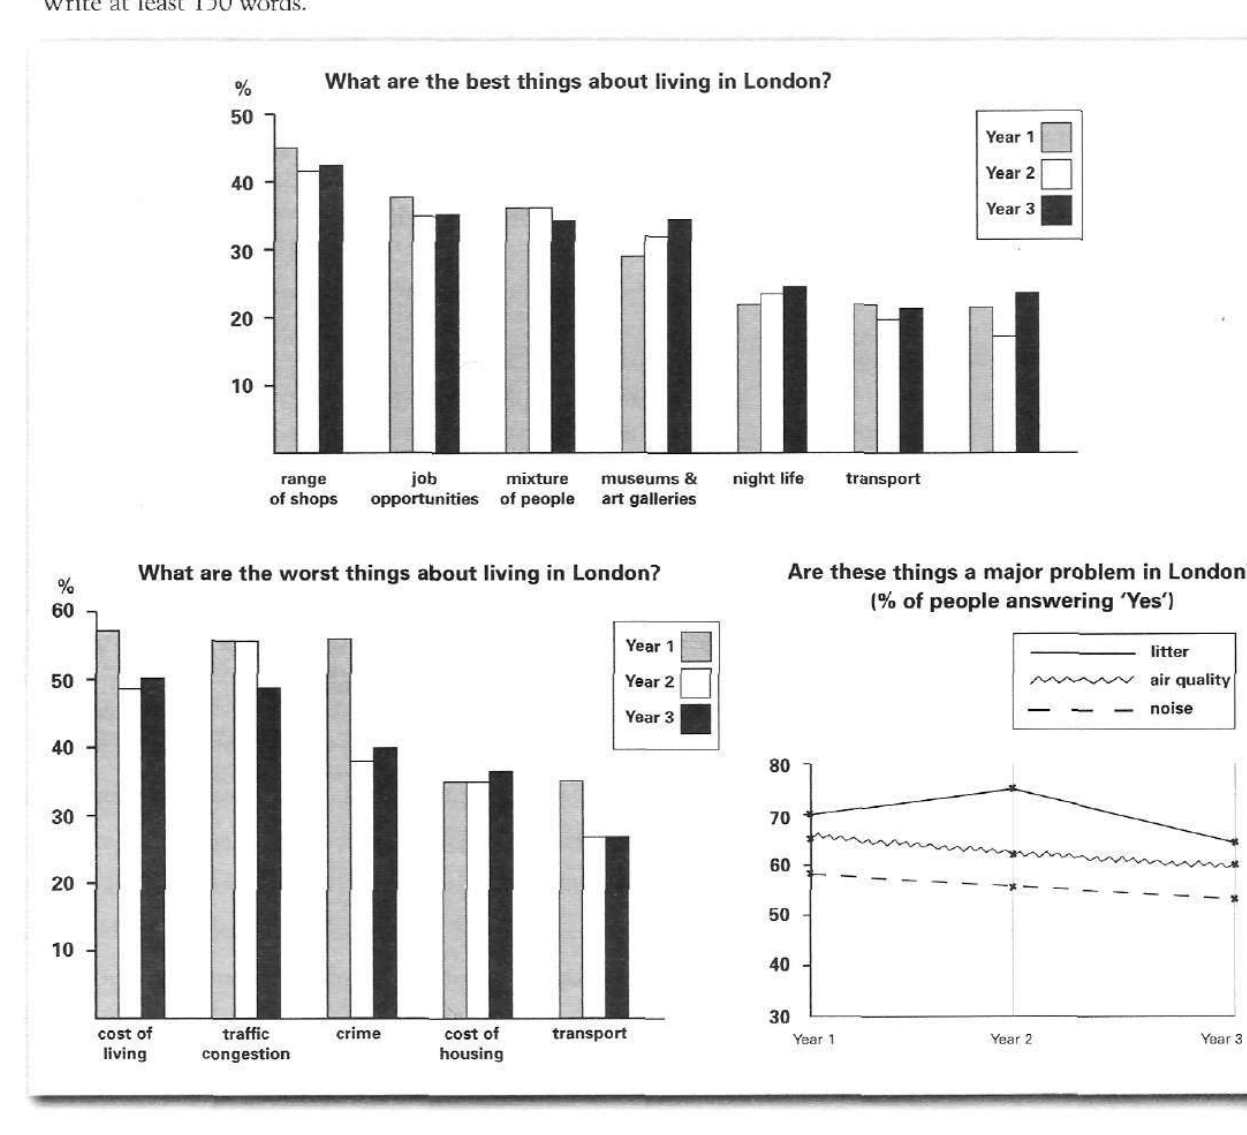
The bar charts and line graph below show the results of a survey conducted over a three-year period to discover what people who live in London think of the city.
Write a report for a university lecturer describing the information below.
What are the best things about living in London?
Student answer (Band 5.5)
The bar charts and line graph illustrate the results of a survey conducted over a three-year period to discover what people who live in London think of the city.
Overall, durning the three-year the highest best thing about living in London was the range of shops. At the same time, a major problem in London was the litter. In addition, fisrt and third year the highest worst thing about the cost of living. Second year a major worst thing was the traffic congestion.
When talk about the best things about living in London, over a three-year period the most best thing about the range of shops. The job opportunities showed gradually declined during the period. The mixture of people one and two year had same percentages and it about around 37%. The musesums and art galleries quality increased slightly between the period. The night life quality also increased during the period. The transport services fluctuated over the years.
Turning to the worst things about living in London, first and third year a majority of worst thing was cost of living and it about 58% and 52%. In contrast, second year most worst thing was trafic congestion and it about approximately 55%. The crime was decreased significantly between one and three year. The cost of living showed one and two year had equal percentages and three year it gradually grew. The transport slightly declined over the period. Looking at the a major problem in London, The bigest problem was the litter, in year one it had 70% and second year 75%. Although it gradually declined in third year. But at the end of period it was the major problem in London. The air quality problem showing moderate percentages between one and three year. The nose was the minor problem in London.
In summary, the most of best thing in London was range of shop. At the same time, the worst thing was cost of living. However, a major problem in London was the litter.
AI examiner evaluation
| Criterion | Band |
|---|---|
| Task Achievement / Task Response | 6.0 |
| Coherence and Cohesion | 6.0 |
| Lexical Resource | 5.0 |
| Grammatical Range and Accuracy | 5.0 |
| Overall | 5.5 |
Task Achievement / Task Response: Band 6.0
You cover all three parts of the visual and give a clear overview: shops are identified as the leading positive feature, litter as the main problem, and cost of living or congestion as leading drawbacks in different years. Several comparisons are supported with figures, such as litter at 70% and 75% in the first two years. However, some details are inaccurate or unclear: cost of living was not the highest worst feature in Year 1 (crime was slightly higher), and it was not equal in Years 1 and 2. The claim that congestion was the top drawback in Year 2 also overlooks cost of living being lower, but crime and congestion comparisons need clearer checking. Some trends, such as air quality, are only broadly described. More precise, consistently accurate comparisons would strengthen the report.
Coherence and Cohesion: Band 6.0
The response has a recognisable structure, moving from an introduction and overview to the positive features, negative features, and a concluding summary. This makes the main categories easy to locate. You also use linking expressions such as “Overall,” “In contrast,” and “Turning to.” However, the overview and conclusion repeat the same points, while the long final body paragraph combines drawbacks with the separate major-problem chart, making the progression less clear. Some transitions are mechanical or awkward, for example “Looking at the a major problem in London,” and “Although” begins a fragment-like contrast. Group the three charts into clearly separated paragraphs and use links to show comparisons rather than repeatedly listing categories.
Lexical Resource: Band 5.0
You use relevant topic vocabulary, including “job opportunities,” “traffic congestion,” “crime,” and “air quality,” so the reader can generally understand which features you mean. There is also some attempt to describe change with “declined,” “increased slightly,” and “fluctuated.” However, vocabulary is repetitive and several phrases are unnatural or imprecise, such as “the most best thing,” “a majority of worst thing,” and “the air quality problem showing moderate percentages.” Spelling errors—including “durning,” “fisrt,” “musesums,” “trafic,” “bigest,” and “nose”—also reduce accuracy. Use standard chart-report collocations such as “the most popular positive feature” and “the proportion citing,” and check spelling carefully.
Grammatical Range and Accuracy: Band 5.0
You attempt both simple and more extended sentences, and some are understandable, such as “The job opportunities showed gradually declined during the period.” However, grammatical control is uneven, particularly in sentence openings and clauses. Examples include “When talk about the best things,” “first and third year a majority of worst thing was…,” and “The air quality problem showing moderate percentages,” where the subject, verb form, or sentence structure is incomplete or faulty. Articles and number expressions also need attention, as in “the a major problem” and “one and two year.” These errors sometimes make relationships between the data less clear. Practise complete subject–verb sentences and accurate past-tense reporting, while varying sentence patterns without sacrificing control.
See this exact question answered at other band scores. The same prompt compared across bands.
Browse more IELTS Writing model answers or get your own writing scored by the same AI examiner.