Band 5.5 IELTS Writing Task 1 Model Answer
Overall Band Score: 5.5 · IELTS Complete Catalyst · 2026-11-18
IELTS Writing Task 1 question
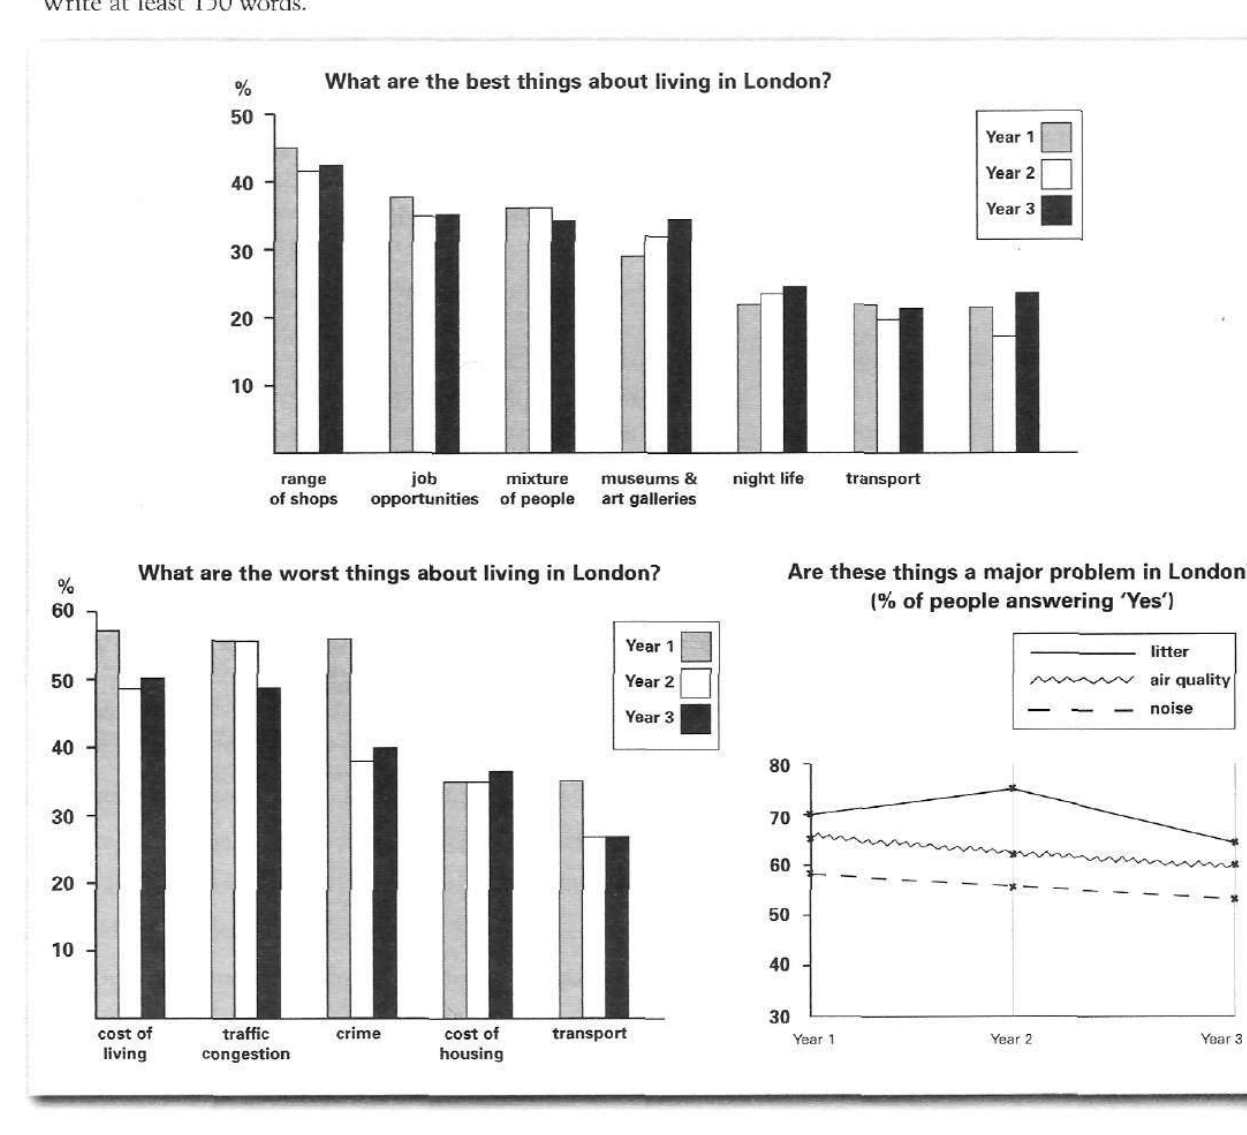
The bar charts and line graph below show the results of a survey conducted over a three-year period to discover what people who live in London think of the city.
Write a report for a university lecturer describing the information below.
What are the best things about living in London?
Student answer (Band 5.5)
The bar chart and line graphs compares the result of a survey on thinking of people who live in london city over a three-year period.
According to the result of the surveys taken over three years about 40-50% people agree that the range of shops is the best thing about living in london. Year 1 have 45% of people thinking that range of shops is the best thing while the interest dropped in year 2 and somewhat increased in year 3 but didn't match the year 1 survey about range of shops. Transport comes last in case of ranking the best things about living in london. Museum & art galleries and night life is the only thing people find best in year 3.
Cost of living, crime and traffic congestion is considered as the worst things about living in london. In year 1 around 57%, 55% and 53% of people agreed that cost of living, crime and traffic congestion is the worst things respectively. The percentage about crime had a decline in year 2 and slight incline in year 3 to about 35% & 37% respectively.
Line graph compares the people accepting that litter, air quality and noise is the major problem in london.In year 2 only the graph shows an inclination of around 85% from 70% of people agreed that litter is the major problem. However most of the people disagree in year 2 & 3 that air quality and noise is the major problem.
AI examiner evaluation
| Criterion | Band |
|---|---|
| Task Achievement / Task Response | 5.0 |
| Coherence and Cohesion | 5.5 |
| Lexical Resource | 5.5 |
| Grammatical Range and Accuracy | 5.0 |
| Overall | 5.5 |
Task Achievement / Task Response: Band 5.0
You identify the main topics in all three visuals and include some relevant figures, such as the 45% who chose shops in Year 1 and the decline in crime-related responses. However, the report only partly describes the data because several figures and comparisons are inaccurate or unclear. For example, crime was about 56%, not 53%, in Year 1, while traffic congestion was about 55.5%; crime then fell to roughly 38% and rose to 40%. The litter figure peaked at about 75% in Year 2, not 85%. The overview is also missing: state the main patterns across the charts, such as shops remaining a leading positive feature and litter being the most widely reported problem. Select and compare key trends more accurately.
Coherence and Cohesion: Band 5.5
The response is divided into paragraphs that broadly follow the three visuals, and sequencing phrases such as “In year 2” and “However” help show some relationships. Nevertheless, the progression within paragraphs is not always clear: the sentence about museums, galleries and nightlife does not explain how these compare with other positive features, and the final paragraph’s contrast between litter and air quality/noise is confusing. Some linking is repetitive or imprecise, and there is no distinct overview to guide the reader through the main findings. Organise the report with an introduction, a concise overview, and focused detail paragraphs. Use comparisons and references that make clear which year and category each statement concerns.
Lexical Resource: Band 5.5
You use relevant topic vocabulary, including “range of shops,” “job opportunities,” “traffic congestion,” and “major problem,” so the subject is generally understandable. However, the range of reporting language is limited, and several word choices or combinations are unnatural, such as “survey on thinking of people,” “the interest dropped,” and “people accepting that litter.” Repetition of “best thing,” “worst things,” and “people” also makes the report less precise. Use standard chart-reporting expressions such as “respondents identified,” “the proportion fell,” and “was regarded as a drawback.” Check spelling and capitalisation of “London,” and use accurate category names consistently. More precise vocabulary would help distinguish opinions, percentages, and changes over time.
Grammatical Range and Accuracy: Band 5.0
You attempt some longer sentences and use time references to describe changes, but grammatical errors are frequent and sometimes make relationships difficult to follow. Subject–verb agreement is a recurring issue: “The bar chart and line graphs compares” should be “compare,” and “Year 1 have 45%” should be “Year 1 had 45%.” There are also problems with articles, plurals, and sentence construction, as in “the worst things” and “the only thing people find best in year 3.” The final paragraph runs sentences together after “london.” Use a wider mix of controlled simple and complex sentences, check agreement and tense, and punctuate each sentence clearly.
See this exact question answered at other band scores. The same prompt compared across bands.
Browse more IELTS Writing model answers or get your own writing scored by the same AI examiner.