Band 5.5 IELTS Writing Task 1 Model Answer
Overall Band Score: 5.5 · IELTS Complete Catalyst · 2026-11-19
IELTS Writing Task 1 question
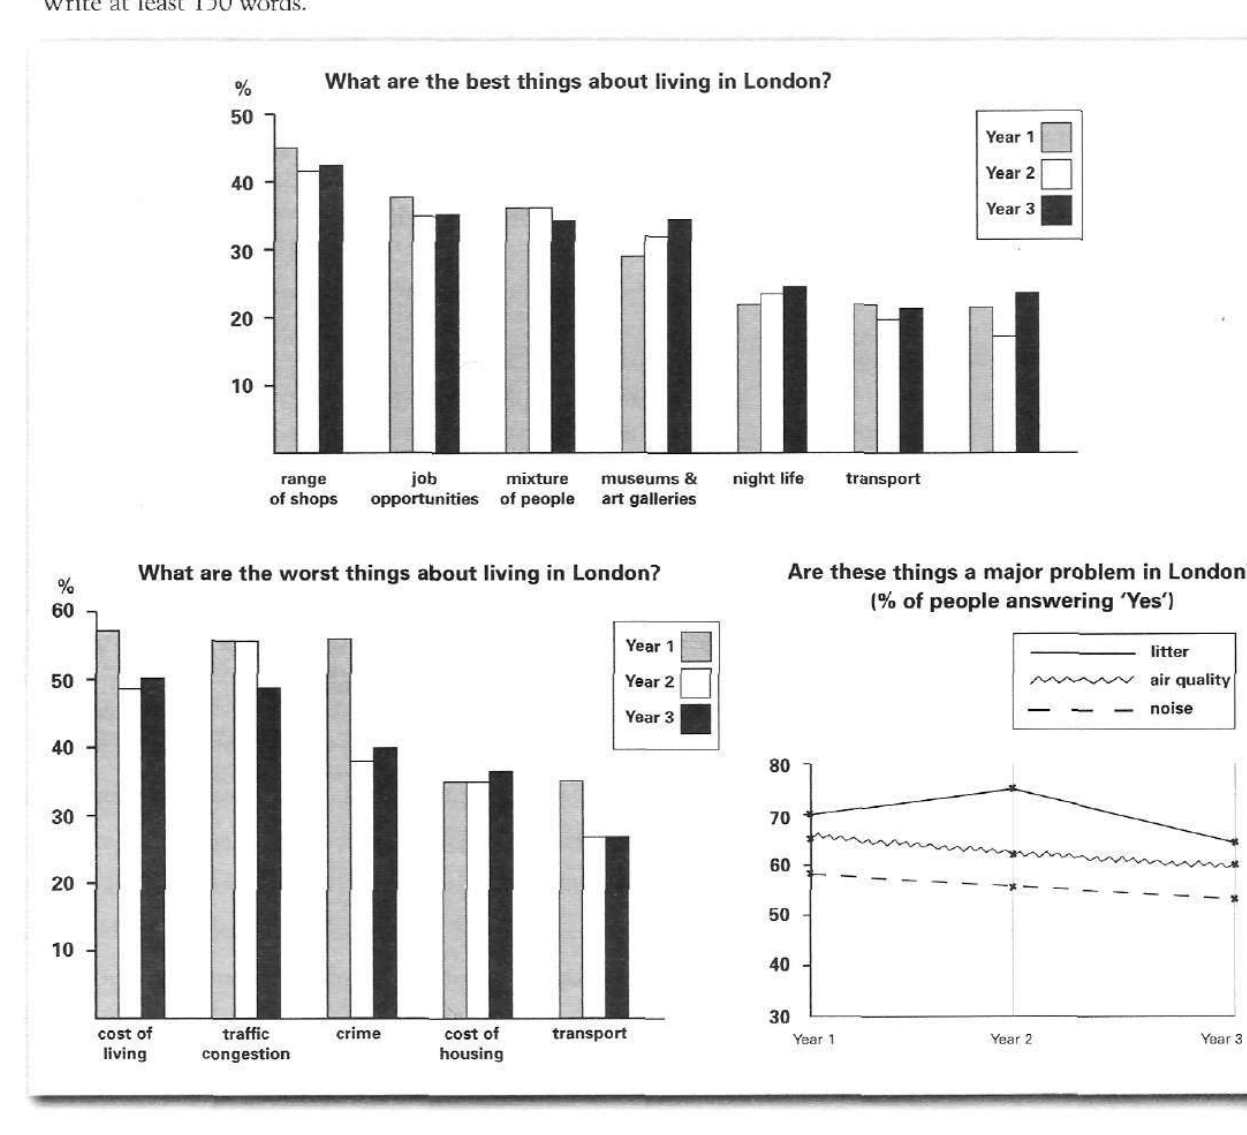
The bar charts and line graph below show the results of a survey conducted over a three-year period to discover what people who live in London think of the city.
Write a report for a university lecturer describing the information below.
What are the best things about living in London?
Student answer (Band 5.5)
The charts illustrates the results about a survery conducted to see what people thing about the city living in London over three years.
Overall, range of the shops was the best things living in London whereas transport was the least. Cost of the living came out to be the worst things in all those three years; however, litter was the major problem people faced.
The best things that people found in London were range of shopes at first in those three years. 45% in 1st year, arounf 41% in 2nd and 42% in 3rd. Job apportunities, mixture of people and museums and art gallaries, these three were at almost same percentage in-between 30s and 40s while night life and transport were at the lowest among all by being at almost 20s or 30s.
The cost of living was considered the worst things about London by being at 58% in first year but then dropped in other two years coming at 50%. Traffic congestion was the second most hated things for the individuals and that was at 55% in starting two years then decresed in third year at 49%. Crime rate had the most highest percentage in the first year with 58% but then it went down to almost 39 to 40% in other two years. Cost of housing and transport were less comparatively.
The major problem that was considered in London was litter at almost 70% in first year, then went up in second year by 75% and then dropped in
AI examiner evaluation
| Criterion | Band |
|---|---|
| Task Achievement / Task Response | 5.5 |
| Coherence and Cohesion | 5.5 |
| Lexical Resource | 5.5 |
| Grammatical Range and Accuracy | 5.0 |
| Overall | 5.5 |
Task Achievement / Task Response: Band 5.5
You identify several key features, including the range of shops as the leading positive feature and litter as a major problem, and you compare changes across the three years. However, coverage is incomplete: the final sentence stops before reporting litter’s Year 3 figure, and the other problem chart (air quality and noise) is not described. Some comparisons are also inaccurate or unclear. For example, cost of living is not the worst-rated item in every year: crime is slightly higher in Year 1, while traffic congestion is higher in Year 2. The overview gives a useful broad summary, but calling transport the least positive feature is not supported because an unlabeled category appears lower in Years 1 and 2. Select the main trends accurately and complete the overview of all three charts.
Coherence and Cohesion: Band 5.5
The response has a recognisable structure: an introduction, an overview, and separate paragraphs for positive and negative features. This helps the reader follow the broad topic. However, progression is weakened by the abrupt ending in the final paragraph and by limited coverage of the third chart. Some linking is mechanical, particularly repeated use of “but then,” “while,” and “and.” The overview also combines several claims in one sentence without clearly distinguishing the best and worst features from the major problems. Grouping the information more systematically—for example, positive features, negative features, then problem ratings—and using clearer comparisons between years would make the report more coherent and cohesive.
Lexical Resource: Band 5.5
You use relevant topic vocabulary such as “job opportunities,” “traffic congestion,” “crime rate,” and “cost of housing,” so the reader can generally understand the categories being compared. However, the range is limited and several word-choice or collocation errors make the report less natural: “the best things living in London,” “the worst things,” and “most hated things” are awkward for a formal data report. Spelling errors such as “survery,” “apportunities,” “gallaries,” and “decresed” are also noticeable. Aim for precise reporting language and check spelling carefully. Phrases such as “was regarded as,” “accounted for,” and “declined to” would help you describe the data more accurately and formally.
Grammatical Range and Accuracy: Band 5.0
You attempt some longer sentences and use past-tense reporting forms, but grammatical control is inconsistent, and errors occur often enough to affect fluency. For example, “The charts illustrates” has subject–verb disagreement, while “what people thing about the city living in London” has an unclear grammatical construction. Articles and plurals are also problematic in phrases such as “range of the shops” and “the worst things.” The final sentence, “then dropped in,” is incomplete, leaving the reader without a finished clause. Build accuracy first with clear subject–verb patterns and complete sentences, then add complex comparisons. Proofreading for agreement, articles, and sentence completion would make your meaning easier to follow.
See this exact question answered at other band scores. The same prompt compared across bands.
Browse more IELTS Writing model answers or get your own writing scored by the same AI examiner.