Band 5.5 IELTS Writing Task 1 Model Answer
Overall Band Score: 5.5 · IELTS Complete Catalyst · 2026-11-20
IELTS Writing Task 1 question
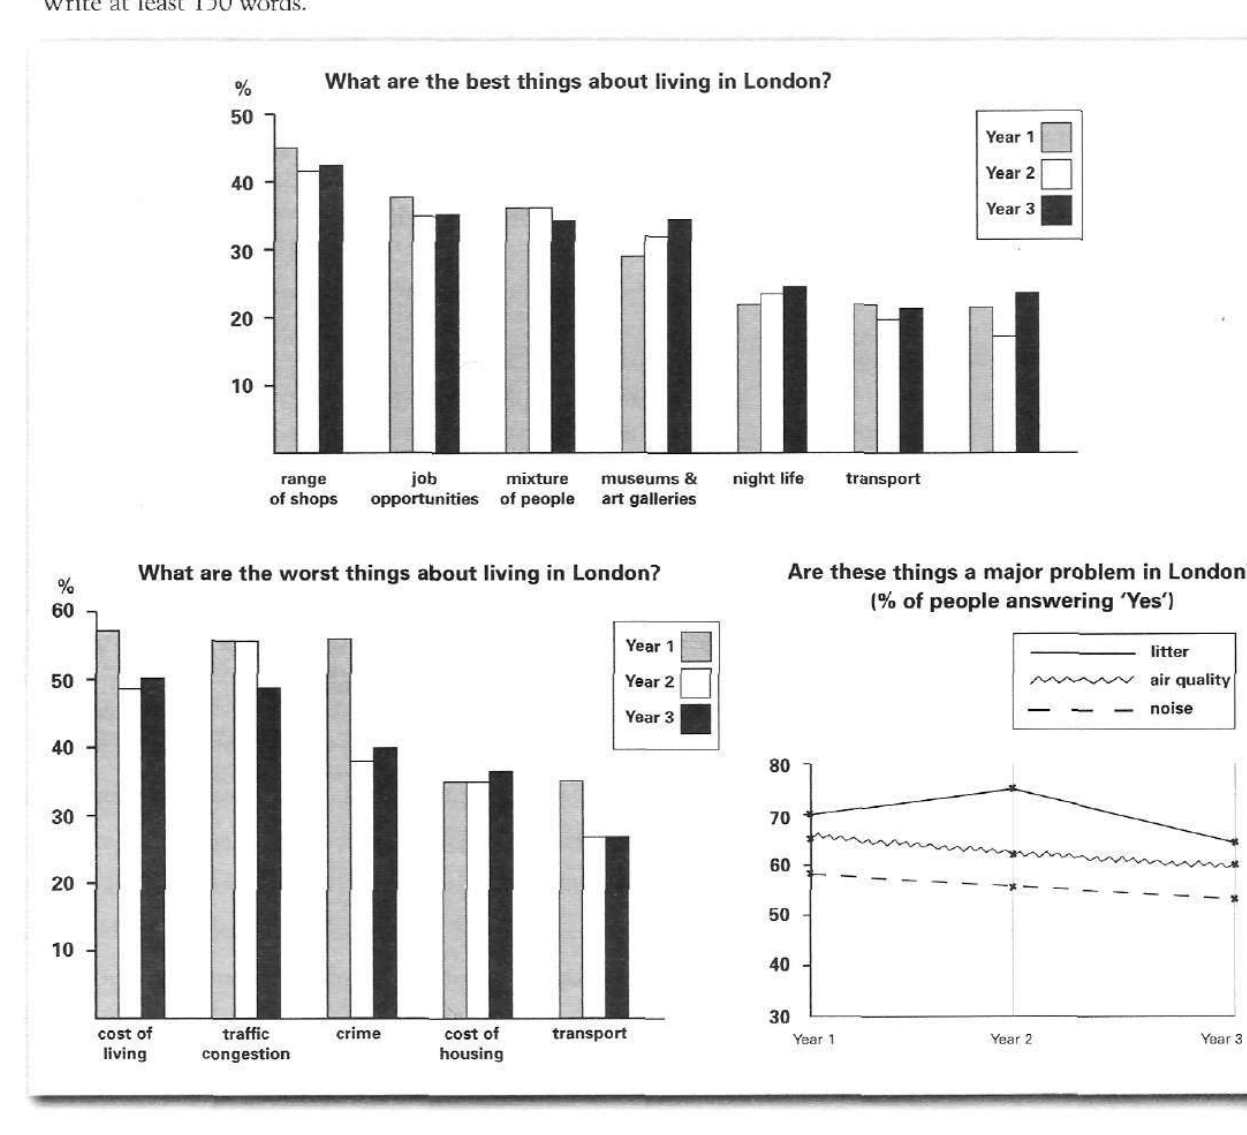
The bar charts and line graph below show the results of a survey conducted over a three-year period to discover what people who live in London think of the city.
Write a report for a university lecturer describing the information below.
What are the best things about living in London?
Student answer (Band 5.5)
The illustration demonstrates the three year data fetched from a survey about the perspective of the residents about the london. Throughout three years, Most people believe that the range of shops in London is something to admire for whereas they find it expensive in terms of living and this opinion has been fluctuating in year 2 and year 3.
Intially, almost 44% of people was impressed by the availablity of shops which declined by 2% in year followed by an increase of 1%. Subsequently, job opportunities has been an attraction to 39% of residents which surged by 1% and plateaued in last year. Afterwards, Diversity among population caught attention by 38% and fall off by 1% in year 3. Similarly. Museums and art galleries has been under 40% during these years. Additionally, nightly life has been above 20% in three years and lastly. transport is below 30% in this time.
The people have pointed out the things they dont like about london include; cost living which has been irregular from 50% to 60%. While traffic congestion stayed consistent for two years and dropped by almost 6%. However crime is also a crucial factor to consider by almost 60% which drastically decreased in the next years. Cost of housing was under 40% and same happened with the transport. 75% people was disappointed and find these factors as a major problem; by the amount of litter in the city during second year followed by 65% citizens which were unhappy with air quality and at last almost 60% with the noise
AI examiner evaluation
| Criterion | Band |
|---|---|
| Task Achievement / Task Response | 5.5 |
| Coherence and Cohesion | 5.5 |
| Lexical Resource | 6.0 |
| Grammatical Range and Accuracy | 5.0 |
| Overall | 5.5 |
Task Achievement / Task Response: Band 5.5
You cover the three chart components and identify relevant themes, including shops as a leading positive feature and litter as a major problem. However, the overview is not fully accurate: the cost of living does not simply fluctuate between 50% and 60%; it falls from about 57% to 49%, then rises slightly. Several details are also misreported: job opportunities decline from about 38% to 35%, rather than rising, and the crime figure falls sharply after Year 1 but is not close to 60% in later years. The final sentence also confuses the categories, linking 65% to air quality when the chart gives that figure for litter in Year 3. Select the main trends more carefully and support them with accurate comparisons.
Coherence and Cohesion: Band 5.5
The response has a recognisable sequence: an introduction and overview are followed by positive features and then problems. This gives the reader a basic framework, and words such as “Additionally” and “However” attempt to connect points. However, progression within paragraphs is often unclear because the report moves through categories with “Intially,” “Subsequently,” and “Afterwards” without consistently showing meaningful comparisons. Some links are awkward or incomplete, such as “Similarly. Museums…” and “and lastly. transport…”. The final section combines several figures and categories in one long sentence, making the relationships difficult to follow. Use clearer paragraphing and group related trends, with linking phrases that explain whether figures rise, fall, or remain stable.
Lexical Resource: Band 6.0
You use a reasonably varied range of vocabulary for describing survey results, including “declined,” “plateaued,” “surged,” and “drastically decreased.” These attempts help you discuss change rather than merely list figures. Some choices, however, are imprecise or unnatural for an academic report: “data fetched,” “something to admire,” “nightly life,” and “crucial factor to consider” do not express the chart information clearly. There are also spelling and form errors, such as “Intially,” “availablity,” and “london.” Aim for standard chart-report collocations and use the chart’s category labels consistently. More precise wording would make your comparisons clearer while retaining the range you already attempt.
Grammatical Range and Accuracy: Band 5.0
You attempt both simple and more complex sentences, including clauses introduced by “whereas” and “which,” but control is inconsistent. Agreement errors occur in “people was impressed” and “job opportunities has been,” while tense and comparison patterns are faulty in phrases such as “declined by 2% in year followed by an increase of 1%.” Articles and prepositions are also missing or misused, for example “about the london” and “cost living.” Punctuation sometimes breaks sentences incorrectly, as in “Similarly. Museums…” and “and lastly. transport…”. These errors can make the data relationships harder to understand. Practise accurate past-tense reporting, subject–verb agreement, and complete sentence boundaries before adding more complex clauses.
See this exact question answered at other band scores. The same prompt compared across bands.
Browse more IELTS Writing model answers or get your own writing scored by the same AI examiner.