Band 5.5 IELTS Writing Task 1 Model Answer
Overall Band Score: 5.5 · IELTS Complete Catalyst · 2026-11-21
IELTS Writing Task 1 question
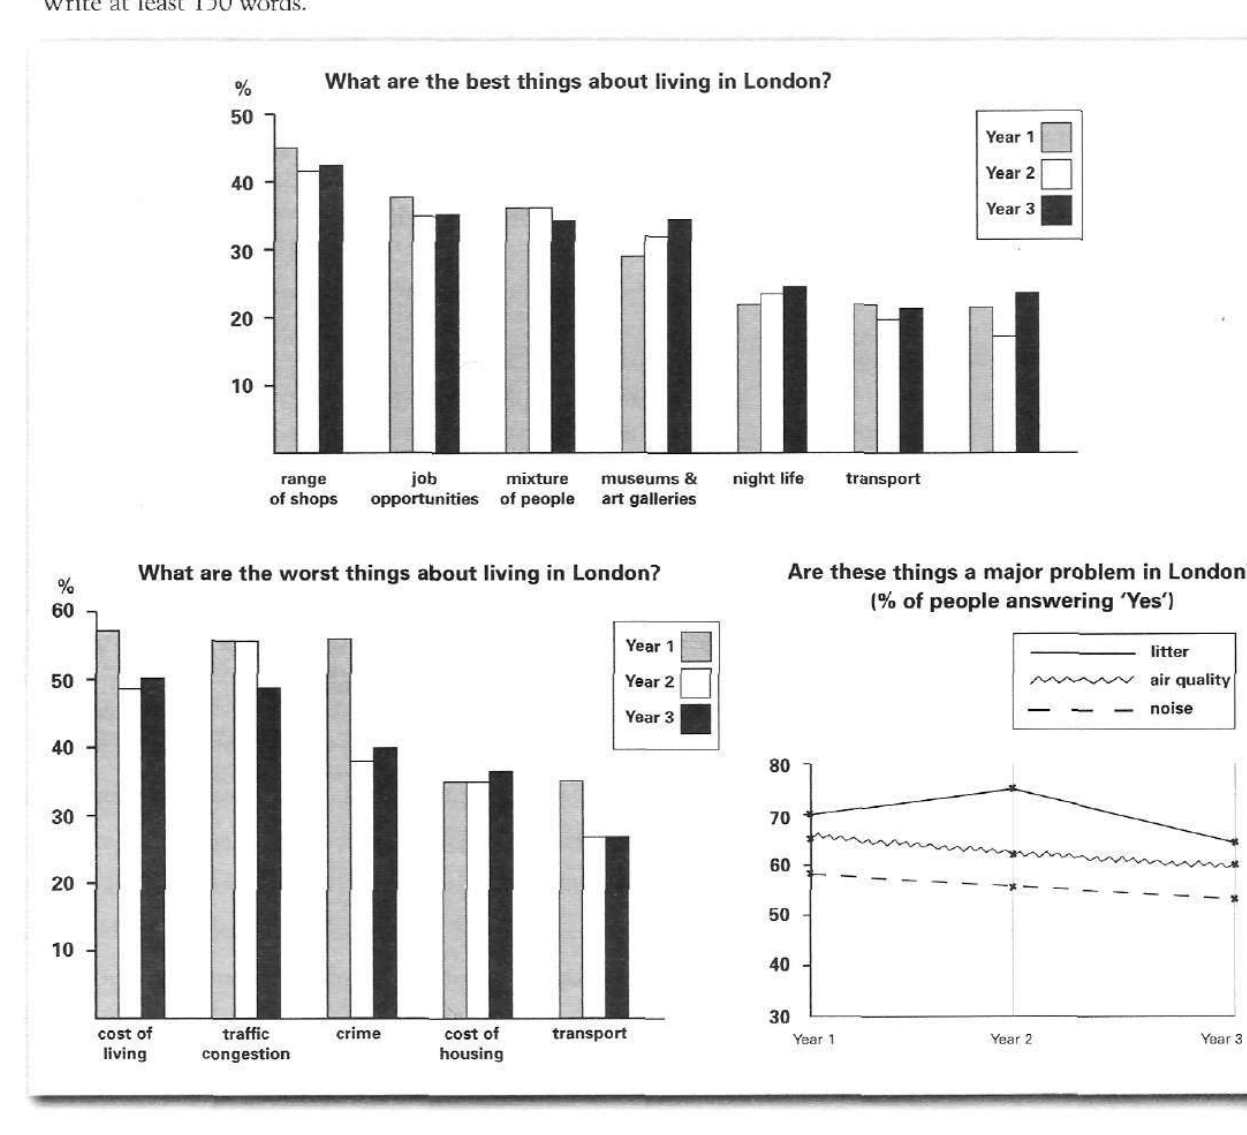
The bar charts and line graph below show the results of a survey conducted over a three-year period to discover what people who live in London think of the city.
Write a report for a university lecturer describing the information below.
What are the best things about living in London?
Student answer (Band 5.5)
The bar charts and line graph given represents the outcomes of a study about what does londoners think about their city over 3 years.
Overall, the range of shops of shops was the best thing about london over the 3 years where transport was the least.The worst thing about living in london based on it's citizens is the cost of living in the first and third year, and traffic congestion came first in the second year.litter was considered as a majour problem in the first year based on the majority and increased to reach it's peak in the second year then had a drop to reach it's lowest in the third year,while air quality and noise came second and third respectively and continued to decrease slowly to reach it's lowest in the third year.
The range of shops was the best thing in london over the 3 years of the survey with an average of 40 percent approximately and transport as the least one of them with about 25 percent in average over the 3 years.While the cost of living in london was thought to be the worst thing about living in london in the first and last year starting with about 58 percent and dropped to 50 percent in the third year.traffic congestion took the first place in the second year with aver 55 percent.
litter started with 70 pecents as th major problem in london and then fluctuated and reach it
AI examiner evaluation
| Criterion | Band |
|---|---|
| Task Achievement / Task Response | 5.5 |
| Coherence and Cohesion | 5.0 |
| Lexical Resource | 5.5 |
| Grammatical Range and Accuracy | 5.0 |
| Overall | 5.5 |
Task Achievement / Task Response: Band 5.5
You identify several relevant headline features, including shops as a leading positive, transport as a low-rated positive, and litter as a major concern. You also compare the leading negative factors across years. However, coverage is incomplete and some claims do not match the chart: shops are not the best-rated category in every year, since job opportunities are higher in Year 1, and transport is not consistently the least-rated positive because the chart includes another category with lower figures. The litter description correctly notes a rise and fall, but the response ends before reporting its final value or completing the comparison. Include a concise overview and select accurate figures and trends from all three visuals.
Coherence and Cohesion: Band 5.0
The response has an identifiable introduction, overview and detail section, and it groups positive and negative opinions before discussing the problem ratings. This gives the reader some organisation. However, progression is weakened by repeated points: the shops and transport comparison appears in both the overview and the following paragraph, as does the cost-of-living trend. Linking is often mechanical or missing, particularly where sentences run together, such as “third year.traffic congestion” and “years.While”. The final sentence is also incomplete, leaving the discussion of litter without a clear ending. Use separate, purposeful paragraphs for the three chart topics, avoid repeating the same figures, and connect comparisons with clear transitions.
Lexical Resource: Band 5.5
You use relevant topic vocabulary such as “range of shops”, “job opportunities”, “traffic congestion” and “air quality”, so the main subject is generally clear. There are also attempts at reporting language, including “considered as a major problem” and “fluctuated”. However, the range is limited and several choices or forms are inaccurate, including “the least one of them”, “came first” and “aver”, while spelling errors such as “majour”, “pecents” and “th major” reduce precision. Repetition of “best thing” and “worst thing” also makes the report less flexible. Build a wider set of accurate chart-reporting phrases and check spelling and collocations before finishing.
Grammatical Range and Accuracy: Band 5.0
You attempt both simple statements and longer sentences with clauses, for example the sentence describing litter’s rise and fall. However, complex structures are often faulty, and errors occur frequently enough to make parts of the report difficult to follow. The opening has incorrect agreement and question structure: “The bar charts and line graph given represents” and “what does londoners think”. Other examples include “the cost of living … is” in a past-period report, “starting with about 58 percent and dropped”, and missing sentence boundaries in “second year.litter”. The final clause, “and then fluctuated and reach it”, is incomplete. Practise accurate past-tense reporting, subject–verb agreement, clause construction and punctuation, then proofread each sentence for completeness.
See this exact question answered at other band scores. The same prompt compared across bands.
Browse more IELTS Writing model answers or get your own writing scored by the same AI examiner.