Band 5.0 IELTS Writing Task 1 Model Answer
Overall Band Score: 5.0 · IELTS Complete Catalyst · 2026-11-05
IELTS Writing Task 1 question
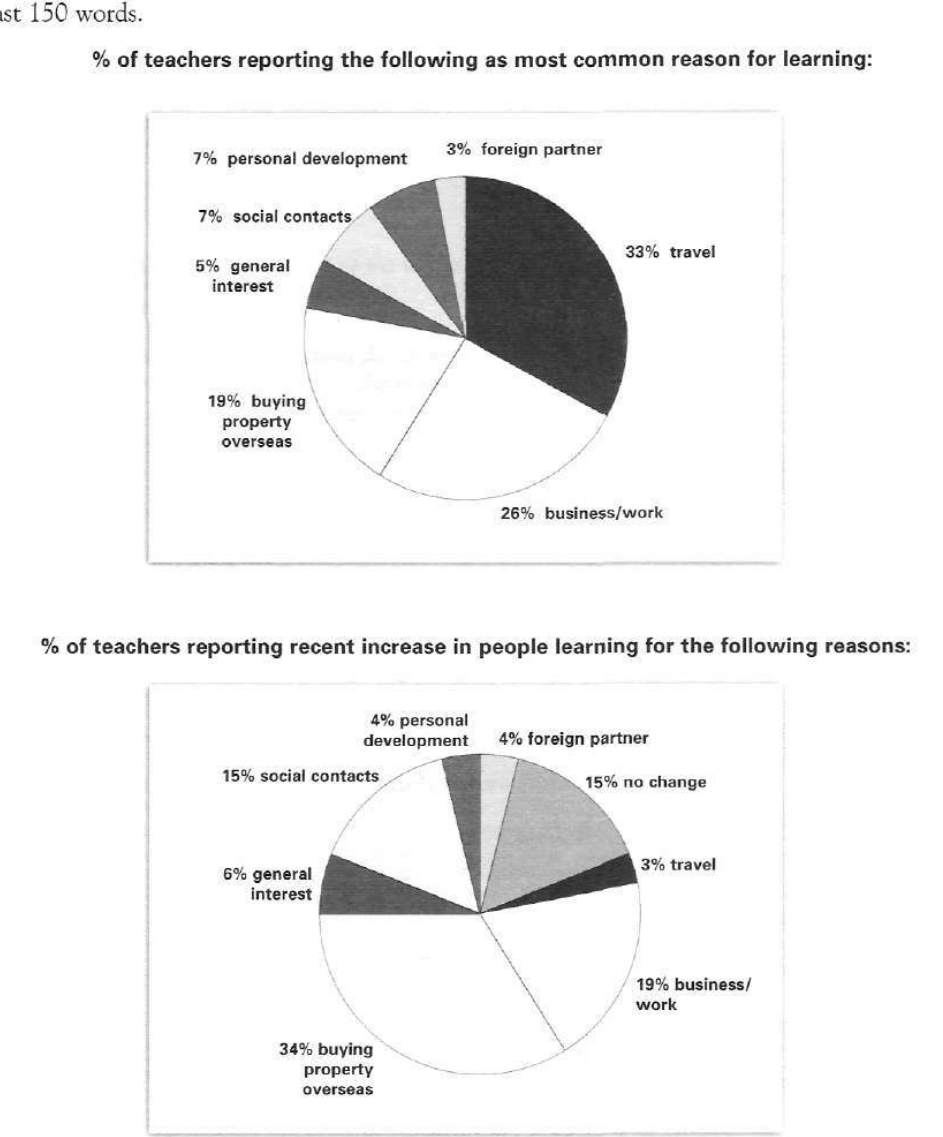
The pie charts below show responses by teachers of foreign languages in Britain to a survey concerning why their students are learning a foreign language. The first chart shows the main reason for learning a foreign language. The second chart shows how many teachers felt that there has been a recent change in the reason.
Write a report for a university lecturer describing the information below.
% of teachers reporting the following as most common reason for learning:
Student answer (Band 5.0)
Two pie charts are given one is about perchantage of teacher given opinion to frequent reason of learning foreign languages and other one is about recent increase of people for followimgs reasons. In first pie chart, it clearly shows trend that most obious reason of studying foreign language for traveling which is 33%. Second higest trend was for business and work purposes and lowest was for general interest which is only 5%. But in second pie chart some variation is observed to reason for reason of learning foreign languages. Here shows, highest trend is observed is 34% for property overseas which is 19% in first pie chart and second highest is work which is similar in both pie chart. But major dissimilarities are seen in travel pupose. In first pie chart that is higher reason but in second pie chart that is very lower reason is seen.
In a conclusion, said that for working purpose to learn foreign language is obvious reason that is ahown in two pie charts.
AI examiner evaluation
| Criterion | Band |
|---|---|
| Task Achievement / Task Response | 5.0 |
| Coherence and Cohesion | 5.5 |
| Lexical Resource | 5.0 |
| Grammatical Range and Accuracy | 5.0 |
| Overall | 5.0 |
Task Achievement / Task Response: Band 5.0
You identify the main reason in the first chart as travel (33%) and correctly note that buying property overseas is the largest category in the second chart (34%), with its first-chart figure of 19%. These are relevant comparisons. However, the report only partly covers the data: it omits several categories and does not clearly explain that the second chart reports teachers’ views on recent changes, including the 15% who reported no change. The conclusion that work is the obvious reason in both charts is not supported: work is 26% in the first chart and 19% in the second, while travel is only 3% in the second. A clearer overview of the contrasting leading reasons and more accurate interpretation would make the response more complete.
Coherence and Cohesion: Band 5.5
The response has a basic sequence: it introduces the charts, discusses the first, compares selected figures from the second, and ends with a conclusion. This gives the reader some overall organisation. However, progression is not consistently clear, and linking phrases such as “But in second pie chart” and “Here shows” do not establish the relationships between ideas accurately. The repeated use of “reason” also makes the comparison feel circular, while the final conclusion conflicts with the earlier point that travel leads the first chart. Group the information into a clear overview and focused comparisons, and use precise references such as “the first chart” and “the second chart” to guide the reader.
Lexical Resource: Band 5.0
You use some task-relevant vocabulary, including “pie charts,” “trend,” “purposes,” and “dissimilarities,” and the reader can generally identify the categories being discussed. However, the range is limited and several word choices or spellings reduce clarity, including “perchantage,” “obious,” “followimgs,” “pupose,” and “ahown.” Phrases such as “highest trend is observed is” and “frequent reason” are also unnatural for describing chart data. Aim for accurate, conventional reporting language and use category labels directly—for example, “the most commonly reported reason” or “the largest proportion.” This would make the comparisons more precise and easier to follow.
Grammatical Range and Accuracy: Band 5.0
The response attempts both simple and longer sentences, but control is inconsistent, and errors frequently affect readability. For example, “Two pie charts are given one is about…” joins two clauses without suitable punctuation or a linking structure. In “Here shows, highest trend is observed is 34%,” the sentence lacks a clear grammatical subject and contains a faulty verb pattern. Articles and sentence structure are also problematic in “for traveling” and “In a conclusion, said that…”. Use complete subject–verb sentences, check articles and prepositions, and separate clauses with appropriate punctuation. More reliable simple structures would help communicate the comparisons before you attempt longer sentences.
See this exact question answered at other band scores. The same prompt compared across bands.
Browse more IELTS Writing model answers or get your own writing scored by the same AI examiner.