Band 4.0 IELTS Writing Task 1 Model Answer
Overall Band Score: 4.0 · IELTS Complete Catalyst · 2026-11-05
IELTS Writing Task 1 question
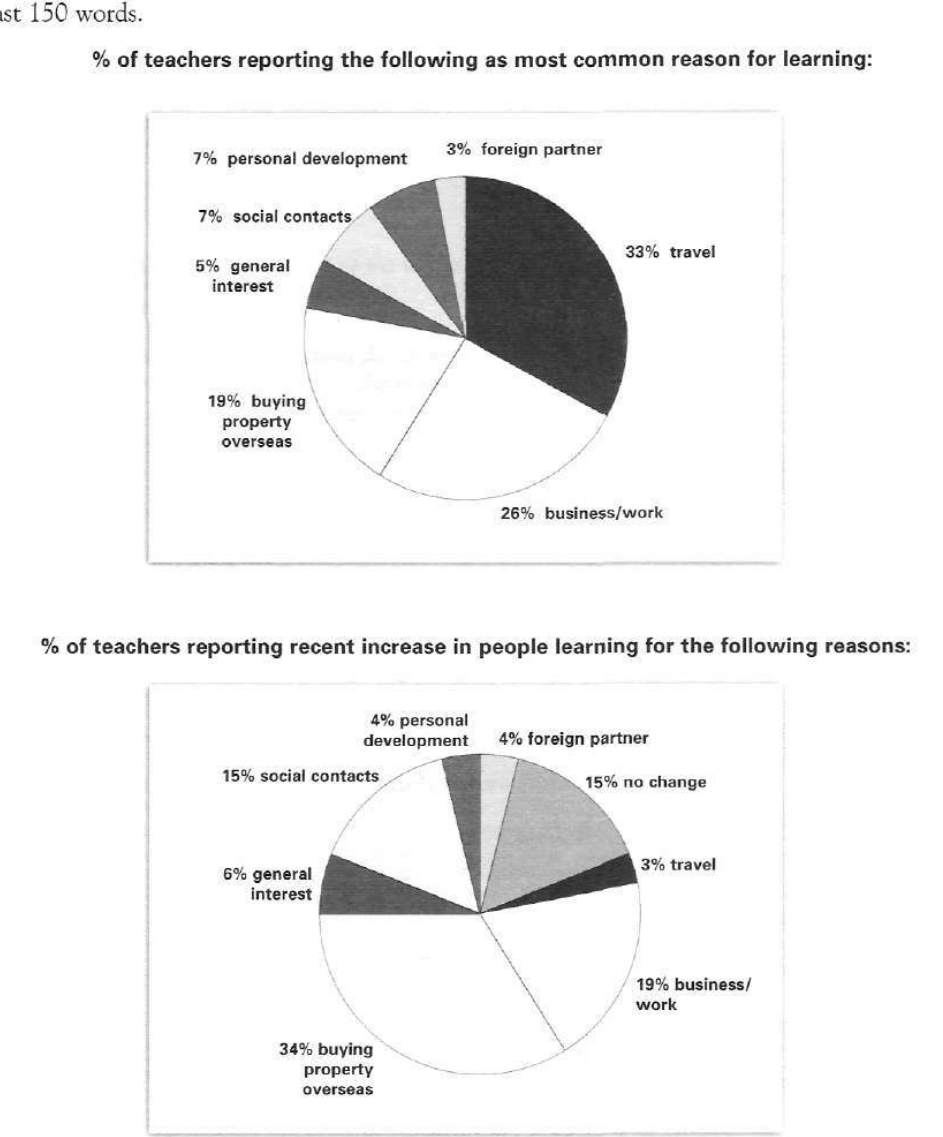
The pie charts below show responses by teachers of foreign languages in Britain to a survey concerning why their students are learning a foreign language. The first chart shows the main reason for learning a foreign language. The second chart shows how many teachers felt that there has been a recent change in the reason.
Write a report for a university lecturer describing the information below.
% of teachers reporting the following as most common reason for learning:
Student answer (Band 4.0)
The pie chart below illustrates responses by teachers of foreign languages in britain to a survey concerning why their students are learning a foreign language.The first chart demonstrate the main reason for learning a foreign language.The second chart illuwtrate how many teachers felt there has been a recent change in the reason
Travel is the main reason with the highest percentage while foreign partner remains the lowest personal development and social contact remains the same then general interest is also the lowest after that business work and buying property overseas are extreme of them
Travel among the highest percentage with 33% and foreign partner remains the lowest with 3% and personal development is 7% and social contacts with also the same percentage with 7% general interest with 5% and businss work 26% and afterall 19% buying property and overseas
But recently the percentages changes 34% buying property overseas and 3% travel 19% business/work then the travel come with 3% general interest comes at 5% social contacts 15% personal development with 4% and at the last general interest with 6$ everything changes so quickly
AI examiner evaluation
| Criterion | Band |
|---|---|
| Task Achievement / Task Response | 3.5 |
| Coherence and Cohesion | 3.5 |
| Lexical Resource | 4.5 |
| Grammatical Range and Accuracy | 4.5 |
| Overall | 4.0 |
Task Achievement / Task Response: Band 3.5
You identify the charts’ subject and report several figures, including travel at 33%, foreign partners at 3%, and buying property overseas at 34% in the recent-change chart. However, the response does not provide a clear, accurate overview of the main patterns. It also misreports general interest in the second chart as 5% rather than 6%, and the statement that “everything changes so quickly” is unsupported. The second chart includes 15% reporting no change, which is omitted, and its figures are not consistently explained as teachers’ reports of recent increases. The response is 142 words, below the 150-word minimum. Add a concise overview, distinguish the charts’ measures, and select the most important comparisons accurately.
Coherence and Cohesion: Band 3.5
There is a basic attempt to move from introducing the charts to describing the first and then the second, so the reader can partly follow the intended order. However, the information is not organised into clear paragraphs, and several ideas are crowded together in long, loosely connected strings. For example, “foreign partner remains the lowest personal development and social contact remains the same” combines separate comparisons without explaining their relationship. Linking words such as “then,” “after that,” and “but” are used, but they do not create a clear progression, and “at the last general interest” is confusing. Use separate paragraphs for the overview and each chart, and group figures by importance rather than listing them in sequence.
Lexical Resource: Band 4.5
You use relevant topic vocabulary, including “percentage,” “foreign partner,” “business/work,” and “buying property overseas,” which allows the reader to recognise the subject of the charts. There are also attempts to describe comparisons, such as “highest” and “lowest.” However, vocabulary is often repetitive or imprecise: “extreme of them” does not clearly express a comparison, and “everything changes so quickly” is informal and unsupported for an academic report. Spelling errors such as “illuwtrate” and “businss” also reduce accuracy. Choose standard chart-reporting expressions such as “accounted for,” “was the most frequently reported reason,” and “the largest share of teachers reported an increase.” Check spelling and avoid conversational claims.
Grammatical Range and Accuracy: Band 4.5
The response includes some simple sentence patterns and attempts to compare figures, but grammatical control is inconsistent. Subject–verb agreement is incorrect in “The first chart demonstrate” and “the percentages changes”; use “demonstrates” and “the percentages changed.” Articles and sentence boundaries are also problematic: the opening runs several sentences together without spaces or clear punctuation, while “Travel among the highest percentage” lacks a verb. The final section contains fragments and unclear constructions, including “then the travel come with 3%.” These errors make relationships between figures difficult to follow. Build complete sentences with a clear subject and verb, use consistent present-tense reporting language, and punctuate each comparison separately.
See this exact question answered at other band scores. The same prompt compared across bands.
Browse more IELTS Writing model answers or get your own writing scored by the same AI examiner.