Band 5.5 IELTS Writing Task 1 Model Answer
Overall Band Score: 5.5 · IELTS Complete Catalyst · 2026-11-08
IELTS Writing Task 1 question
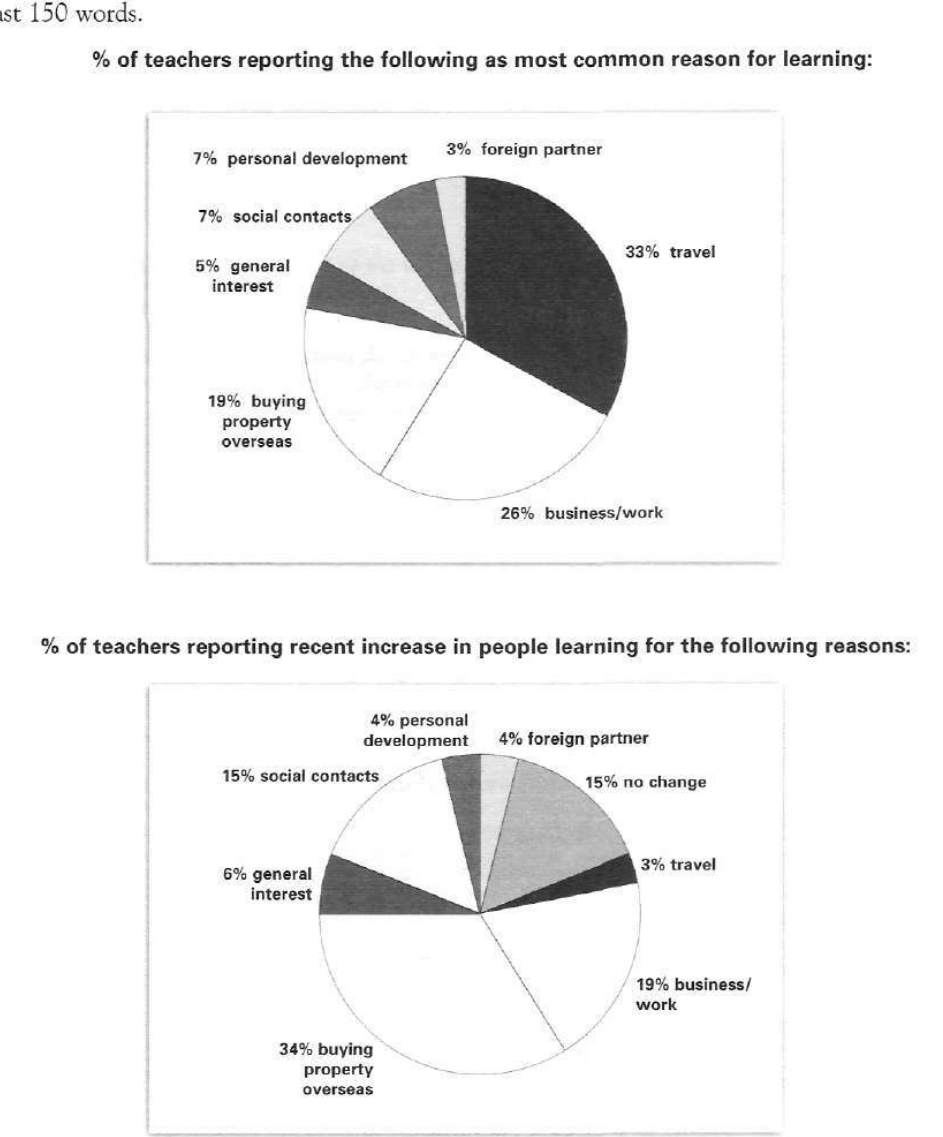
The pie charts below show responses by teachers of foreign languages in Britain to a survey concerning why their students are learning a foreign language. The first chart shows the main reason for learning a foreign language. The second chart shows how many teachers felt that there has been a recent change in the reason.
Write a report for a university lecturer describing the information below.
% of teachers reporting the following as most common reason for learning:
Student answer (Band 5.5)
Bhot pie chart show diffferent responses of teachers learning foreign language.First pie chart shows the common reasons for learning (like travel,work,buying property,general interest,social contacts and personal development) and second chart shows people increase in learning(foreign partner,travel,buying property,work,no change,interest,contacts,development).
In initial chart, the highest percentage in comman learning reasons is 33% of traveling and the lowest percentage has foreign partner which is 3%. This evaluate that learning of foreign for traveling in the most common reason.
In last pie chat, recent increase is described for learning forign highest percentage is for buying property overseas 34% and lowest increase is for travleing which is 3%. This shows that increase in buying property is more then any other.
To evaluate bhot, the common reason is for traveling and recent increase is in the buying property for overseas. This shows people are interested in buying properties thats why they learn foregin to demonstrate it.
AI examiner evaluation
| Criterion | Band |
|---|---|
| Task Achievement / Task Response | 5.5 |
| Coherence and Cohesion | 5.5 |
| Lexical Resource | 5.0 |
| Grammatical Range and Accuracy | 5.0 |
| Overall | 5.5 |
Task Achievement / Task Response: Band 5.5
You identify the main extremes in both charts accurately: travel is the leading common reason at 33%, foreign partners the smallest at 3%, and buying property overseas is the largest reported recent increase at 34%, while travel is lowest at 3%. This gives the report relevant coverage of the data. However, the response is only partly developed: it does not compare the other categories in a meaningful way, and it omits notable figures such as work/business at 26% in the first chart and 19% in the second. The second chart also includes 15% reporting no change, which is not clearly explained. The final claim that people learn languages to buy properties is an unsupported interpretation; report what teachers said rather than infer learners’ motives.
Coherence and Cohesion: Band 5.5
The response has a basic overall structure: an opening identifies the charts, followed by a paragraph on each chart and a brief concluding comparison. This makes the main points possible to follow. However, progression is limited because the body paragraphs largely repeat the highest and lowest figures, and the conclusion restates those same points rather than synthesising a broader comparison. Linking phrases such as “In initial chart,” “In last pie chat,” and “To evaluate both” are awkward or unclear, while the long opening list of categories does not establish a useful hierarchy. Organise the report around an overview and then grouped comparisons, using clear references such as “By contrast” or “Meanwhile” only where the data supports them.
Lexical Resource: Band 5.0
You use some task-relevant vocabulary, including “percentage,” “common reasons,” “recent increase,” and “buying property overseas,” so the reader can recognise the subject and key comparisons. However, the range is limited and several word-choice, collocation, and spelling problems make the report less clear or less formal. Examples include “Bhot,” “comman,” “pie chat,” “forign,” and “travleing”; “learning of foreign” is also an incomplete and unnatural phrase. Repetition of “highest percentage” and “increase” further restricts expression. Use accurate chart-reporting language such as “accounted for,” “was the most frequently cited reason,” and “the smallest share,” and proofread spelling carefully.
Grammatical Range and Accuracy: Band 5.0
Most sentences use simple structures, and the reader can generally identify the intended comparisons. There are attempts to connect ideas, for example, “This shows that increase in buying property is more then any other,” but the sentence is not grammatically controlled. Errors occur frequently in articles, sentence construction, and agreement: “Bhot pie chart show” lacks a correct subject and verb, while “the lowest percentage has foreign partner” uses an unsuitable structure. The opening also runs several clauses together without clear punctuation. Build reliable simple sentences first—for example, “Travel was the most common reason, at 33%”—then add a small number of accurate complex sentences. Check articles, verb forms, and sentence boundaries during revision.
See this exact question answered at other band scores. The same prompt compared across bands.
Browse more IELTS Writing model answers or get your own writing scored by the same AI examiner.