Band 5.0 IELTS Writing Task 1 Model Answer
Overall Band Score: 5.0 · IELTS Complete Catalyst · 2026-11-08
IELTS Writing Task 1 question
The pie charts below show responses by teachers of foreign languages in Britain to a survey concerning why their students are learning a foreign language. The first chart shows the main reason for learning a foreign language. The second chart shows how many teachers felt that there has been a recent change in the reason.
Write a report for a university lecturer describing the information below.
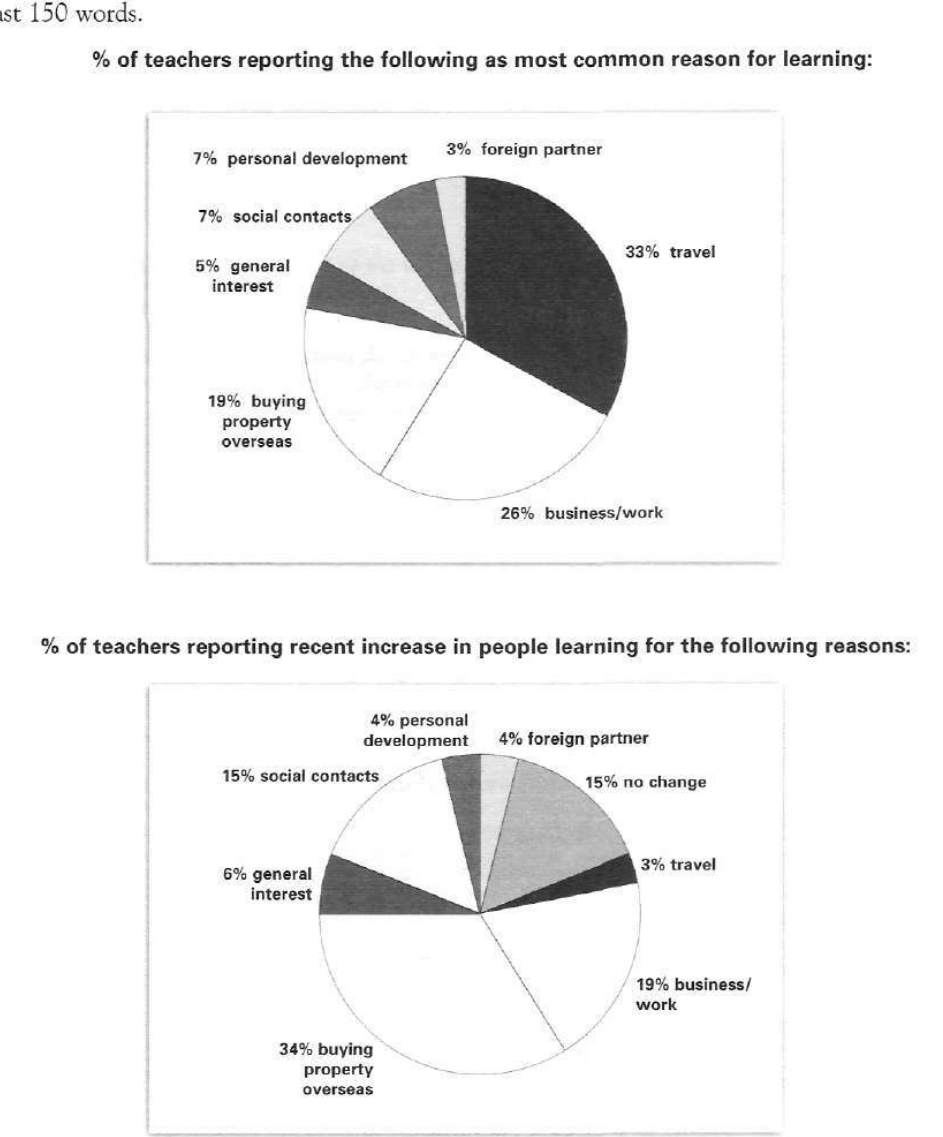
% of teachers reporting the following as most common reason for learning:
Student answer (Band 5.0)
The pie charts illustrates give information about the Britain survey why students learning foreign language responses by teacher and the reason in recent this is increase.
In the overview, the first charts shows the main reason for learning foregin language, and the seconde charts shows the reason of recent change.
Looking at the first charts, the most common reason for learning foregin language in travel that is 33%. Therefore, the business people learning foregin language in 26%. In buying property overseas, people learning foregin language in 19%. However, the personal development and social contacts people learning for foregin language in 7%. Again in general interest, people learning foregin language in 5%. In contrast, the lowest people learning foregin language in this chart for foregin partner that is 3%.
Turning to the second charts, the increase in people learning foregin language in buying property overseas that is 34%. Again, the business/work people learning in 19%. However, the people learning in no change and social contacts that is 15%. In general interest, people learning in 6%. Therefore, the foregin partner people learning foregin language in 4%. In contrast, the lowest is travel people learning foregin language in 3%.
AI examiner evaluation
| Criterion | Band |
|---|---|
| Task Achievement / Task Response | 5.0 |
| Coherence and Cohesion | 6.0 |
| Lexical Resource | 5.0 |
| Grammatical Range and Accuracy | 4.5 |
| Overall | 5.0 |
Task Achievement / Task Response: Band 5.0
You identify the leading reason in the first chart—travel at 33%—and accurately report several other figures, including business/work at 26% and buying property overseas at 19%. You also cover the second chart and correctly note that buying property overseas is highest at 34%. However, the overview mainly restates what each chart shows rather than summarising the key contrast: travel leads as the main reason, while property purchases are the most frequently reported recent increase. Some details are unclear or incomplete; for example, the 15% for “no change” is not a reason for learning, and the 4% for personal development in the second chart is omitted. A clearer overview and more precise explanation of what the second chart measures would make the report more complete.
Coherence and Cohesion: Band 6.0
The response has a recognisable structure: an introduction, an overview, and separate paragraphs for the two charts. Phrases such as “Looking at the first charts” and “Turning to the second charts” help signal the shift between sets of information. However, progression within the paragraphs is sometimes mechanical, with repeated “Therefore,” “Again,” and “In contrast,” even where the relationship between figures is not a contrast. The overview also repeats the introduction instead of guiding the reader towards the main comparisons. Grouping the figures more deliberately—for example, highest and lowest values, followed by the remaining categories—would improve flow, while more accurate linking would make relationships clearer.
Lexical Resource: Band 5.0
You use relevant chart vocabulary, including “most common reason,” “increase,” “lowest,” and “buying property overseas,” so the topic is generally understandable. However, the range is limited and several phrases are repeated, especially “people learning foreign language.” Some word combinations are unnatural or unclear, such as “the business people learning foreign language in 26%” and “the increase in people learning foreign language in buying property overseas.” There are also spelling errors, including “foregin” and “seconde.” Use concise reporting language and vary the verbs and nouns used to describe proportions. More accurate collocations would make the information easier to follow and show greater control of vocabulary.
Grammatical Range and Accuracy: Band 4.5
The report attempts a few different sentence patterns, including introductory clauses such as “Looking at the first charts” and “Turning to the second charts.” However, many sentences lack a complete or correctly formed clause, as in “the most common reason … in travel that is 33%” and “the lowest is travel people learning … in 3%.” Articles, plurals, and verb forms are also inconsistent: “the first charts shows” and “students learning foreign language responses by teacher” make the relationships difficult to interpret. Most statements follow a similar simple pattern, and attempts to connect ideas do not consistently produce accurate sentences. Practise complete comparison sentences, such as “Travel was the most common reason, at 33%,” and check subject–verb agreement and article use.
See this exact question answered at other band scores. The same prompt compared across bands.
Browse more IELTS Writing model answers or get your own writing scored by the same AI examiner.