Band 6.0 IELTS Writing Task 1 Model Answer
Overall Band Score: 6.0 · IELTS Complete Catalyst · 2026-11-08
IELTS Writing Task 1 question
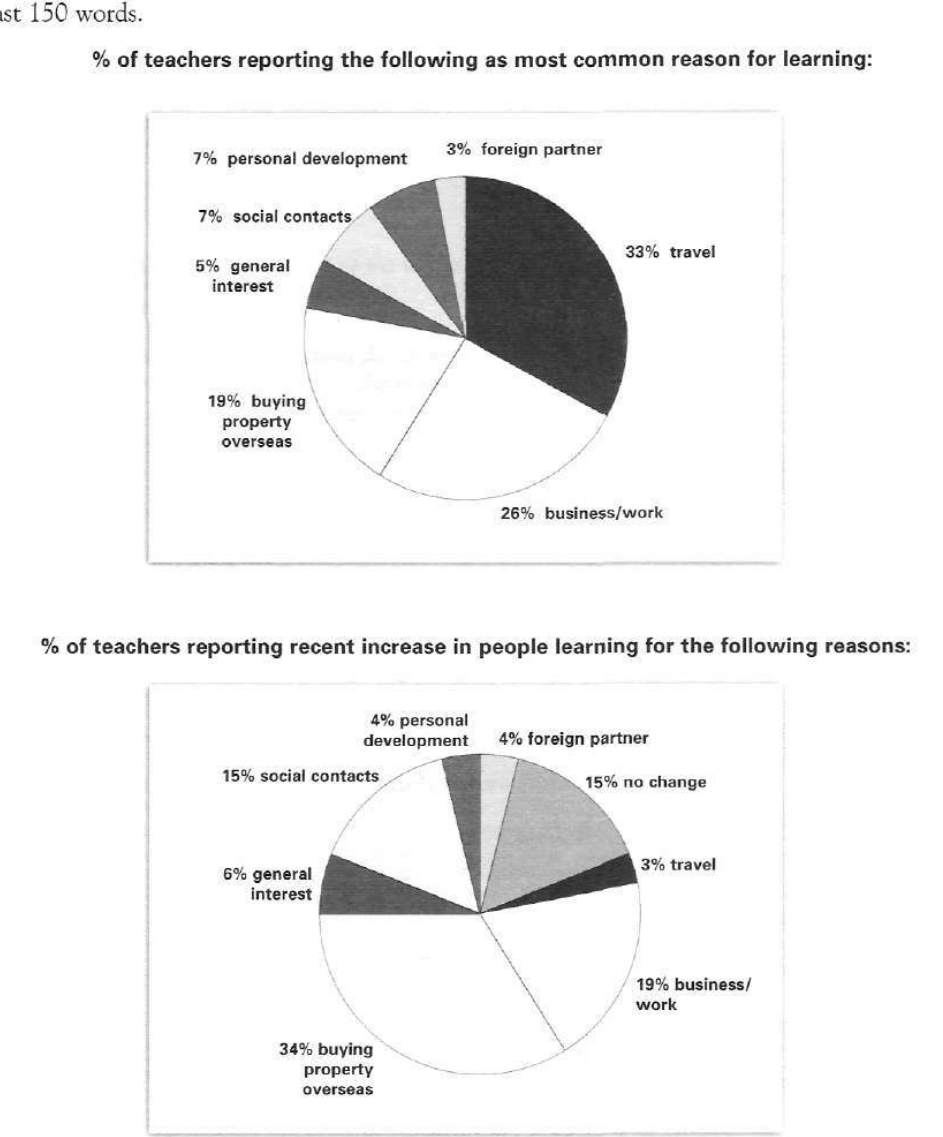
The pie charts below show responses by teachers of foreign languages in Britain to a survey concerning why their students are learning a foreign language. The first chart shows the main reason for learning a foreign language. The second chart shows how many teachers felt that there has been a recent change in the reason.
Write a report for a university lecturer describing the information below.
% of teachers reporting the following as most common reason for learning:
Student answer (Band 6.0)
The pie chart illustrate the results of a survey of foreign language teachers in Britain regarding why their students are learning a language, and whether teachers have noticed a change in motivation.
Overall, travel was by far the most common reason, while the second chart shows that most teachers felt there had been a change in reason.
In detail, the main reason is that student learn foreign languge for travel at 33%. Moreover, the business and work were accounting for 26%, with student choosing it. In additon, a further 19% cited another tongue as the main reason. Personal development and social contacts were both regions by 7% of teachers. Furthermore, ganeral interest was the least reason at just 5%.
Buying property overseas was by far the most recent increased at 34%.The business/work was represent for 19%. Subsequently, social contacts andno change were both teachers report by 15% of climbed. General interest and personal developent accounting for 6% and 4%, respectively. Travel was the least reason represented to 3%.
AI examiner evaluation
| Criterion | Band |
|---|---|
| Task Achievement / Task Response | 6.0 |
| Coherence and Cohesion | 6.5 |
| Lexical Resource | 5.5 |
| Grammatical Range and Accuracy | 5.0 |
| Overall | 6.0 |
Task Achievement / Task Response: Band 6.0
You cover both charts and identify several important figures accurately: travel is the leading main reason at 33%, while buying property overseas is the largest reported recent increase at 34%. The overview also attempts to compare the charts. However, it misrepresents the second chart by saying “most teachers felt there had been a change”; the largest share reported an increase for buying property overseas, while 15% reported no change. Some details are unclear or inaccurate: “a further 19% cited another tongue” does not identify buying property overseas, and the second chart’s 4% for foreign partners is omitted. A clearer overview and more precise descriptions of what each percentage represents would make the report more complete.
Coherence and Cohesion: Band 6.5
The response has a recognisable structure: an introduction, an overview, and separate detail paragraphs for the two charts. This gives the reader a generally coherent route through the information, and linking expressions such as “Moreover” and “Furthermore” help signal additions. However, some connections are mechanical, and the sequence of figures is not always easy to follow. In the first detail paragraph, “a further 19%” is not linked clearly to its category; in the second, “Subsequently” does not express a meaningful relationship between the figures. The phrase “social contacts andno change” also disrupts readability. Grouping the largest figures first and using clear category references would improve progression and cohesion.
Lexical Resource: Band 5.5
You use some task-relevant vocabulary, including “survey,” “main reason,” “business/work,” and “personal development,” and you attempt to vary your descriptions with phrases such as “by far the most common.” However, inaccurate word choice and spelling often make the report less precise. “Another tongue” is an unclear substitute for buying property overseas, while “regions” and “was represent” do not convey the intended meaning. There are also noticeable spelling errors, including “languge,” “additon,” “ganeral,” and “developent.” Aim for accurate, natural collocations for describing chart data, such as “accounted for,” “was reported as,” and “the proportion of teachers.”
Grammatical Range and Accuracy: Band 5.0
The response includes both simple statements and some attempts at more developed structures, such as “while the second chart shows…” and “with student choosing it.” However, control of sentence structure and verb forms is inconsistent. The opening should be “The pie chart illustrates,” and “student learn” needs a plural subject and an appropriate verb form. In “The business/work was represent for 19%,” the passive construction is not formed correctly; “accounted for 19%” would be grammatical. Missing spaces and punctuation, as in “34%.The” and “andno change,” also affect accuracy. More reliable subject–verb agreement, articles, and complete sentence patterns would strengthen the report.
See this exact question answered at other band scores. The same prompt compared across bands.
Browse more IELTS Writing model answers or get your own writing scored by the same AI examiner.