Band 5.0 IELTS Writing Task 1 Model Answer
Overall Band Score: 5.0 · IELTS Complete Catalyst · 2026-11-11
IELTS Writing Task 1 question
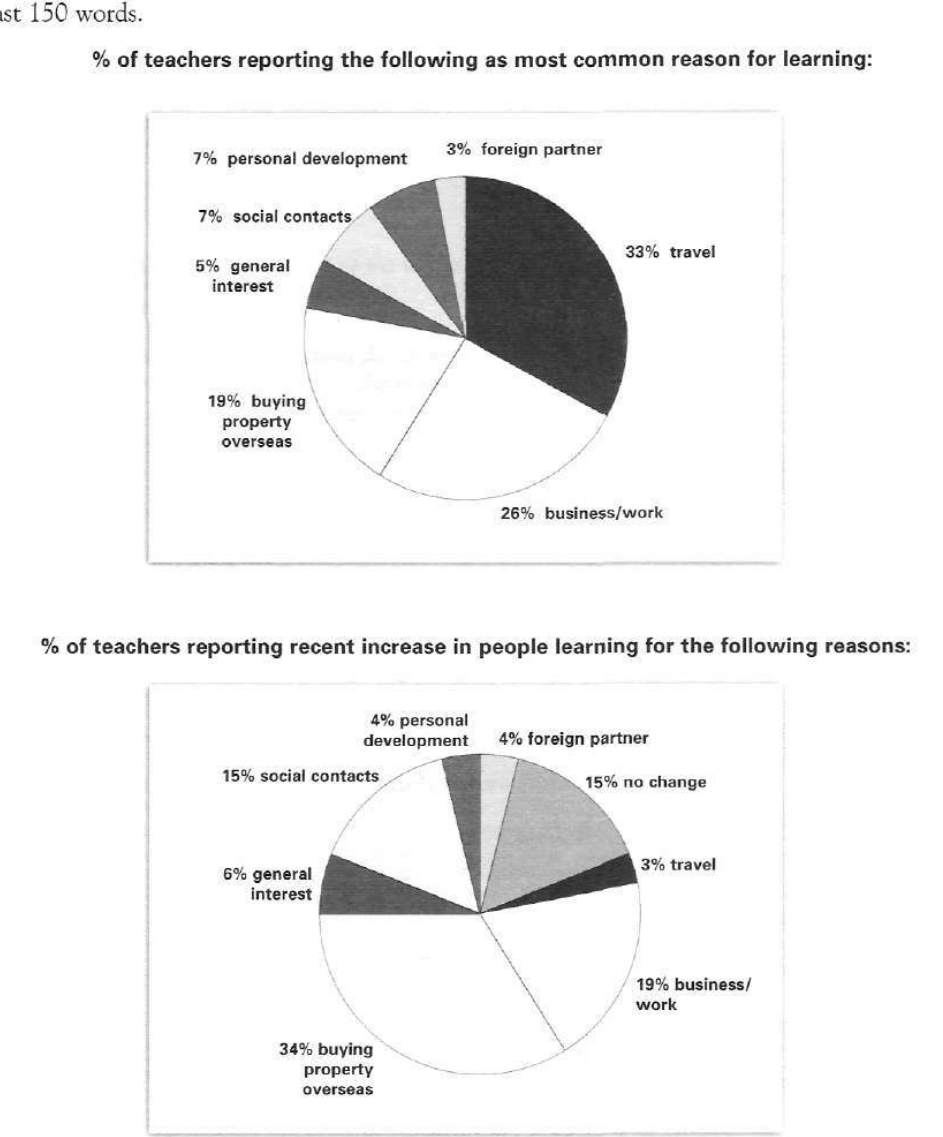
The pie charts below show responses by teachers of foreign languages in Britain to a survey concerning why their students are learning a foreign language. The first chart shows the main reason for learning a foreign language. The second chart shows how many teachers felt that there has been a recent change in the reason.
Write a report for a university lecturer describing the information below.
% of teachers reporting the following as most common reason for learning:
Student answer (Band 5.0)
the pie charts compare the percentage of a survey concerning to know the fact why their learners are learning other nation language.
from the first chart it is clear that the highest number of students learn foreign language for travel and business or work and in the second chart tutor notice that the purpose of learnig anouther language has been changed and the reason is buying property overseas.by contrast,foreigner partner recieved the lowest percentage.
buying property overseases was the 3rd higest proportion of learning language,at 19% but in recent teachers analysing it came to on top position.adopting anouther language for personal development and social contacts hold same position which is 7%.only 5% learner learn foreign language for their general interest.
from the pie chart 2 it seem that people show much interest leaning language for business or work purpose and the percentage is 19%.their is a dramatic change in travel and it came only 3% from 33%.
AI examiner evaluation
| Criterion | Band |
|---|---|
| Task Achievement / Task Response | 5.0 |
| Coherence and Cohesion | 5.0 |
| Lexical Resource | 5.0 |
| Grammatical Range and Accuracy | 5.0 |
| Overall | 5.0 |
Task Achievement / Task Response: Band 5.0
You identify several important features, including travel as the leading initial reason (33%), business/work at 26%, and buying property overseas as the largest reported recent increase (34%). You also note that travel accounts for only 3% in the second chart. However, the report only partially covers the data: it does not explain the second chart’s 15% reporting no change, and the overview is unclear about what the second chart measures. The claim that foreign partners received the lowest percentage is also imprecise: this category is 3% in the first chart, while travel is the lowest at 3% in the second. A clearer overview and more accurate comparisons across both charts would make the key information easier to understand.
Coherence and Cohesion: Band 5.0
The response has some organisation: it begins with an introduction, gives a broad summary, and then discusses selected figures in later paragraphs. However, the progression is not consistently clear. The second paragraph combines the leading reasons, the change in purpose, and the lowest category without clearly separating the two charts. Phrases such as “by contrast” and “from the pie chart 2” provide some linking, but connections are sometimes awkward or unclear, and the final paragraph repeats information about travel and business/work rather than developing a distinct comparison. Group the first chart’s reasons together, then describe the second chart’s reported changes, using clear references to each chart and avoiding repetition.
Lexical Resource: Band 5.0
You use some relevant task vocabulary, including “percentage,” “proportion,” “purpose,” and “dramatic change,” and the reader can generally identify the categories being discussed. However, the range is limited and several word choices or collocations are inaccurate, sometimes making the meaning difficult to follow. For example, “a survey concerning to know the fact” and “tutor notice” do not express the intended ideas naturally; “the purpose … has been changed” also misrepresents a chart about reported increases. Spelling errors such as “learnig,” “anouther,” and “overseases” are noticeable. Use precise chart-reporting phrases such as “teachers reported,” “the most common reason,” and “the proportion reporting an increase,” and check spelling carefully.
Grammatical Range and Accuracy: Band 5.0
You attempt both simple and more extended sentences, for example, “from the first chart it is clear that…” and “buying property … was … 19% but … it came to on top position.” However, control is inconsistent, and frequent errors in sentence structure, verb forms, agreement, articles, and punctuation sometimes make the relationships between ideas difficult to follow. Examples include “the reason is buying property overseas,” “only 5% learner learn,” and “their is a dramatic change.” Several sentences also run together without appropriate punctuation, as in the final paragraph. Practise forming complete sentences with a clear subject and verb, use plural forms after percentages where appropriate, and check articles and punctuation. More accurate sentence patterns would make your comparisons much clearer.
See this exact question answered at other band scores. The same prompt compared across bands.
Browse more IELTS Writing model answers or get your own writing scored by the same AI examiner.