Band 5.5 IELTS Writing Task 1 Model Answer
Overall Band Score: 5.5 · IELTS Complete Catalyst · 2026-11-12
IELTS Writing Task 1 question
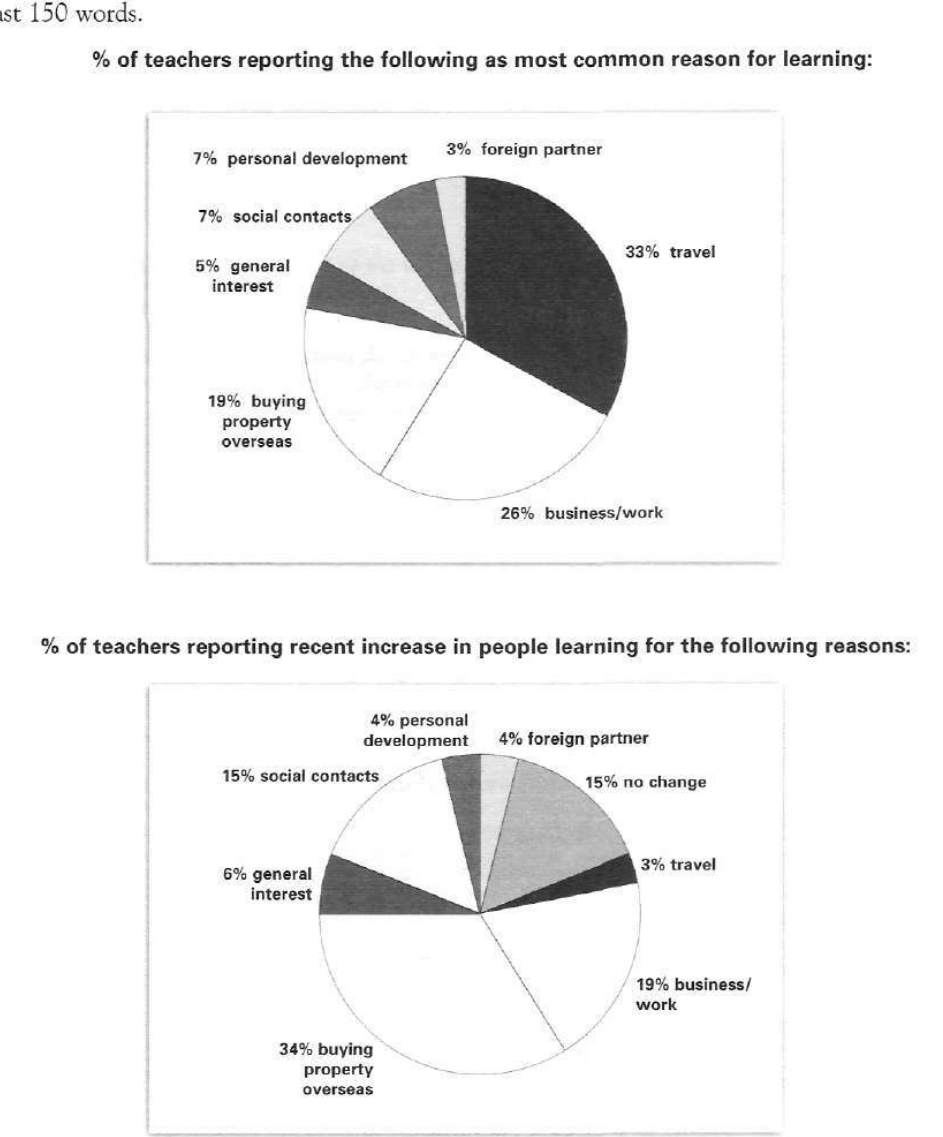
The pie charts below show responses by teachers of foreign languages in Britain to a survey concerning why their students are learning a foreign language. The first chart shows the main reason for learning a foreign language. The second chart shows how many teachers felt that there has been a recent change in the reason.
Write a report for a university lecturer describing the information below.
% of teachers reporting the following as most common reason for learning:
Student answer (Band 5.5)
The two given pie charts shows the responses of teachers concerning reasons to learn foreign language in Britain.
Overall,the first chart shows most common reason for learning is travel and the least would be for the foreign partner.The second chart shows that recent changes in reason for learning has been seen in different fields.
To commence with,33% teachers think that most students learn a foreign language to travel and 26% teachers think that they learn for business and work,while 19% of them think that buying property overseas is also a common reason.7% tutors believe that its for personal development and social contacts each.The least interested field is general interest(about 5%).
The recent increases in the reasons for learning have noticed by the teachers.34% of teachers noted that it is for the reason to buy property overseas.Teachers describing business and work as a reason stood at 19%.There is no change to 15% teachers and same % change to social contacts.The general interest is about 6% changed among teachers and teachers supporting the reason for personal development and for foreign partners stood at 4% each
AI examiner evaluation
| Criterion | Band |
|---|---|
| Task Achievement / Task Response | 5.5 |
| Coherence and Cohesion | 6.0 |
| Lexical Resource | 5.5 |
| Grammatical Range and Accuracy | 5.0 |
| Overall | 5.5 |
Task Achievement / Task Response: Band 5.5
You identify the main pattern in the first chart: travel is the leading reason at 33%, while foreign partners are the least common at 3%. You also report several figures accurately, including business/work at 26% and buying property overseas at 34% in the second chart. However, the overview of the second chart is vague: it says changes occurred “in different fields” without highlighting that buying property overseas was the most frequently reported increase, while travel was lowest at 3%. Some details are unclear or inaccurate: “There is no change to 15% teachers” refers to the separate no-change category, and the 3% travel figure is omitted. A clearer overview and more precise coverage of the second chart would make the report more complete.
Coherence and Cohesion: Band 6.0
The response has a recognisable structure: an introduction and overview are followed by one paragraph for each chart. This makes the information generally easy to follow, and phrases such as “To commence with” signal a shift to details. However, progression within the final paragraph is less controlled: the figures are listed in quick succession, and the relationship between “no change” and the increase categories is not clearly explained. “Same % change to social contacts” is especially difficult to interpret. Some linking is mechanical, and punctuation spacing is inconsistent, as in “Overall,the” and “19%.There”. Use clearer transitions and group the second-chart figures by their significance to improve cohesion.
Lexical Resource: Band 5.5
You use relevant vocabulary for describing survey results, including “most common reason,” “recent increases,” and “stood at,” and the range is sufficient to communicate the main categories. However, several word choices and collocations are inaccurate or awkward, such as “the least interested field,” “the recent increases … have noticed by the teachers,” and “same % change.” These expressions make some details harder to understand. “Reason for learning” is also repeated frequently, and “teachers” and “think” recur where more precise reporting verbs could help. Aim for natural chart language such as “the least commonly cited reason,” “teachers reported an increase,” and “the proportion reporting no change.”
Grammatical Range and Accuracy: Band 5.0
You attempt both simple and more complex sentences, including a comparison joined with “while,” and the overall meaning is usually recoverable. However, errors in agreement, articles, and sentence construction are frequent enough to affect clarity. For example, “The two given pie charts shows” should use a plural verb, while “33% teachers” needs an article or a different construction. The sentence “The recent increases … have noticed by the teachers” has an incorrect passive form, and “The general interest is about 6% changed” is not grammatically well formed. There are also missing spaces after full stops and commas. Practise accurate reporting structures, such as “Teachers reported that…” and “The figure for … was…,” before adding more complex clauses.
See this exact question answered at other band scores. The same prompt compared across bands.
Browse more IELTS Writing model answers or get your own writing scored by the same AI examiner.