Band 5.5 IELTS Writing Task 1 Model Answer
Overall Band Score: 5.5 · IELTS Complete Catalyst · 2026-11-13
IELTS Writing Task 1 question
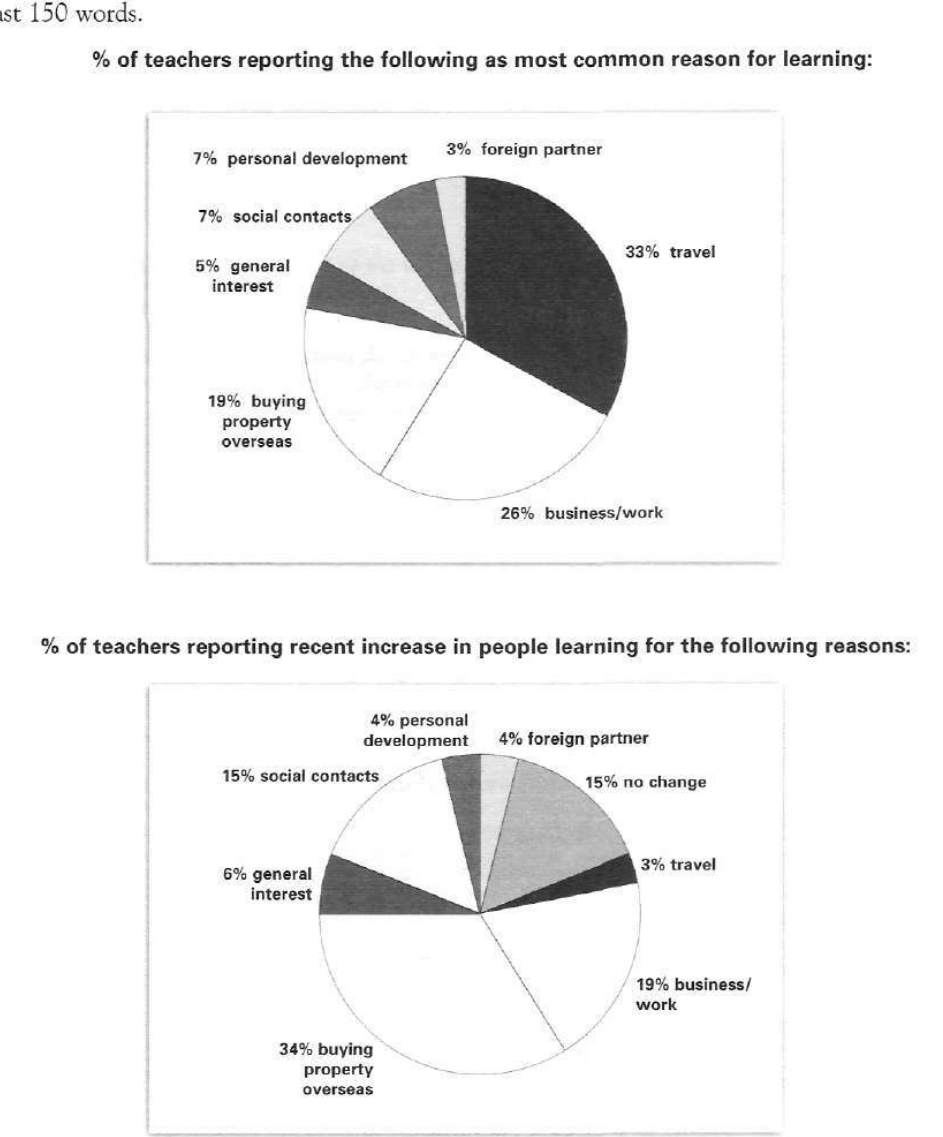
The pie charts below show responses by teachers of foreign languages in Britain to a survey concerning why their students are learning a foreign language. The first chart shows the main reason for learning a foreign language. The second chart shows how many teachers felt that there has been a recent change in the reason.
Write a report for a university lecturer describing the information below.
% of teachers reporting the following as most common reason for learning:
Student answer (Band 5.5)
These pie charts illustrates responses by teachers of foreign language to survey related to students why they are learning foreign language. First pie chart contrast main reason behind learning english and second graph shows percentages that recently increase in people learning.
Overall, in first pie chart describes that most of people who want to travel abroad learn foriegn language but in second chart its percentage decrease while in second pie chart, percentage of teacher reporting recent increases as of percentage those people who are buying property in overseas increased than earlier.
first pie chart shows 33% people learn foriegn language to travel to abroad while its percentage decrease to 3% in second pie chart furthermore Those people who has business in overseas percentage is 26% while in ratio number decrease to 19% morever those people who are buying property in overseas surged from 19% to 34%.
People with general interests increased 5% to 6% while social contacts ratio also gain good interets from 7% to 15%.
AI examiner evaluation
| Criterion | Band |
|---|---|
| Task Achievement / Task Response | 5.5 |
| Coherence and Cohesion | 5.5 |
| Lexical Resource | 5.0 |
| Grammatical Range and Accuracy | 5.0 |
| Overall | 5.5 |
Task Achievement / Task Response: Band 5.5
You identify the main contrast: travel is the leading reason in the first chart, while buying property overseas is the largest reported recent increase in the second. Several figures are also accurately compared, including business/work (26% versus 19%) and social contacts (7% versus 15%). However, the report only partially covers the data. It omits foreign partners and personal development, and it does not explain that the second chart reports teachers’ views of recent increases rather than a direct change in the first chart’s percentages. The claim that travel “decrease[s]” from 33% to 3% is therefore misleading: these are different measures. Give a clearer overview of the two charts and describe the second chart as reported increases, not as a direct comparison of the same figures.
Coherence and Cohesion: Band 5.5
The response has a basic structure, moving from an introduction to an overview and then to selected details. This gives the reader some sense of organisation, and comparisons such as 26% versus 19% are grouped together. However, progression is not consistently clear: the overview repeats “in second chart” and the body treats the two charts as if their figures show a direct rise or fall. Linking words such as “furthermore” and “morever” are used, but they do not always clarify the relationship between ideas. The final paragraph adds two figures without a concluding summary. Organise the details by chart, use accurate references such as “by contrast” only where appropriate, and make each paragraph’s purpose clear.
Lexical Resource: Band 5.0
You use some relevant vocabulary for describing charts, including “percentage,” “increased,” “decrease,” and “surged,” so the topic is generally recognisable. However, the range is limited and several word choices or collocations are inaccurate or awkward, such as “learn foriegn language,” “travel to abroad,” “ratio number,” and “gain good interets.” Spelling errors, including “foriegn,” “morever,” and “interets,” also reduce precision. In addition, “surged” is stronger than necessary for a change from 19% to 34%. Aim for standard chart-reporting phrases and check spelling; precise wording will make the comparisons easier to understand.
Grammatical Range and Accuracy: Band 5.0
You attempt both simple and more extended sentences, and the reader can usually identify the intended comparisons. However, grammatical control is inconsistent, with frequent errors in sentence structure, agreement, articles, and prepositions. For example, “These pie charts illustrates” has a plural subject with a singular verb, while “first pie chart describes that” is an incomplete or awkward clause. In “those people who has business,” the verb does not agree with the plural subject, and several sentences run together without clear punctuation. Use a reliable pattern such as “The first chart shows that…” and check subject–verb agreement, articles, and sentence boundaries. More accurate basic structures would improve clarity.
See this exact question answered at other band scores. The same prompt compared across bands.
Browse more IELTS Writing model answers or get your own writing scored by the same AI examiner.