Band 4.5 IELTS Writing Task 1 Model Answer
Overall Band Score: 4.5 · IELTS Complete Catalyst · 2026-11-13
IELTS Writing Task 1 question
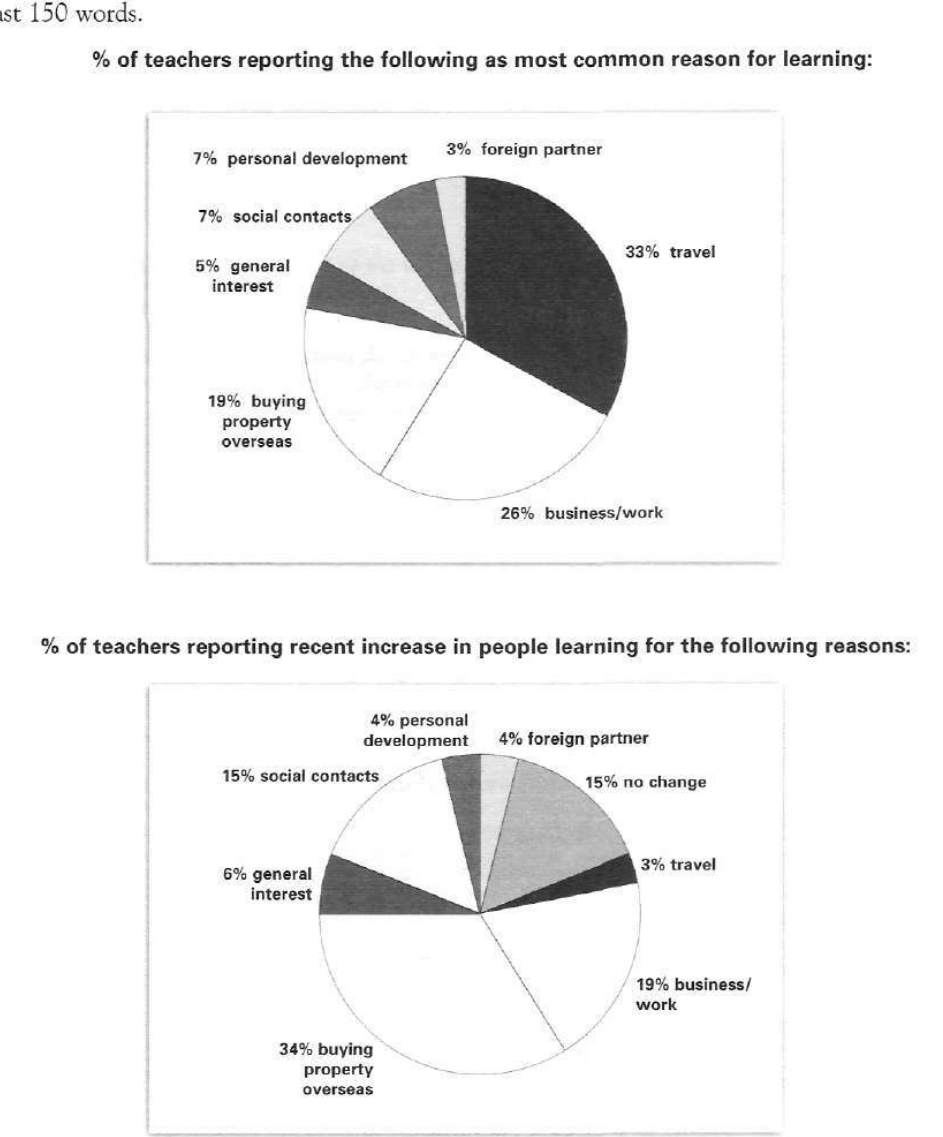
The pie charts below show responses by teachers of foreign languages in Britain to a survey concerning why their students are learning a foreign language. The first chart shows the main reason for learning a foreign language. The second chart shows how many teachers felt that there has been a recent change in the reason.
Write a report for a university lecturer describing the information below.
% of teachers reporting the following as most common reason for learning:
Student answer (Band 4.5)
The pie chart below illustrates responses by teachers of foreign languages in Britain to a survey concerning why their students are learning a foreign language.The first chart demonstrate the main reason for learning a foreign language The second chart shows how many teachers felt that there has been a recent change in the reason
travel remains the highest proportion and foreign partner remains the lowest while business work and other few purposes remains the same and other are extreme of them
Travel is highest with 33% while foreign is lowest at 3% personal development and social contacts remains the same with 7% general interest is 5% business and work is 26% and some goes for buying property in overseas
In second chart everything changing now with 34% of buying property overseas and travel decline to 3% a huge drastically downfall while foreign and personal development remains the same at 4% general interest is 6% social contracts is at 15% while 15% is no change
AI examiner evaluation
| Criterion | Band |
|---|---|
| Task Achievement / Task Response | 4.5 |
| Coherence and Cohesion | 4.5 |
| Lexical Resource | 5.0 |
| Grammatical Range and Accuracy | 4.5 |
| Overall | 4.5 |
Task Achievement / Task Response: Band 4.5
You identify the charts’ subject and report several accurate figures, including travel at 33%, foreign partners at 3%, and overseas property at 34% in the second chart. However, the response is under the required 150 words (116 words; 49 words copied from the prompt are excluded), and important information is missing or unclear. In particular, you do not report the first chart’s 19% for buying property overseas, and you describe the second chart as showing “everything changing,” although it includes 15% reporting no change. The overview is also vague: “other are extreme of them” does not clearly summarise the main patterns. Add a concise overview and compare the key categories accurately, including the 26% business/work figure in the second chart.
Coherence and Cohesion: Band 4.5
There is a basic attempt to organise the report by chart: the opening introduces both charts, and later sentences describe the first and second sets of figures. This gives the reader some sense of sequence. However, the response has no clear paragraphing, and ideas within sentences are often joined without punctuation or logical links. For example, the opening runs directly from “foreign language” into “The first chart demonstrate,” while the first-chart details are presented as a list rather than grouped into a clear comparison. The phrase “while business work and other few purposes remains the same” is difficult to follow and does not establish what is being compared. Use separate paragraphs for the overview and chart details, and organise each chart’s figures around its highest and lowest categories.
Lexical Resource: Band 5.0
You use relevant chart vocabulary such as “proportion,” “highest,” “lowest,” and “decline,” and the topic-specific terms generally make the categories recognisable. However, the range is limited and several expressions are inaccurate or awkward, which makes some comparisons unclear. “A huge drastically downfall” combines an adjective and adverb unnaturally, while “some goes for buying property in overseas” does not communicate the figure or comparison clearly. “Social contracts” also changes the chart label “social contacts,” and “other few purposes” is vague. Aim for precise reporting language and accurate category names, using phrases such as “accounted for,” “stood at,” and “was the largest share.” Avoid repeating “highest” and “lowest” without explaining the relevant figures.
Grammatical Range and Accuracy: Band 4.5
The response communicates some basic information through simple clauses, but grammatical control is inconsistent and sentence structures are mostly simple or run together. There are errors in agreement and verb forms, such as “The first chart demonstrate” and “personal development and social contacts remains,” where the subject and verb do not agree. Missing sentence boundaries and punctuation also make the opening difficult to read: “foreign language.The first chart…” should be separated and punctuated. The final sentence strings together several figures with repeated “while,” without clear clause structure. Practise accurate subject–verb agreement, articles, and complete sentences, then use a few controlled comparison structures, for example, “Travel was the leading reason, at 33%, whereas foreign partners accounted for only 3%.”
See this exact question answered at other band scores. The same prompt compared across bands.
Browse more IELTS Writing model answers or get your own writing scored by the same AI examiner.