Band 5.0 IELTS Writing Task 1 Model Answer
Overall Band Score: 5.0 · IELTS Complete Catalyst · 2026-11-16
IELTS Writing Task 1 question
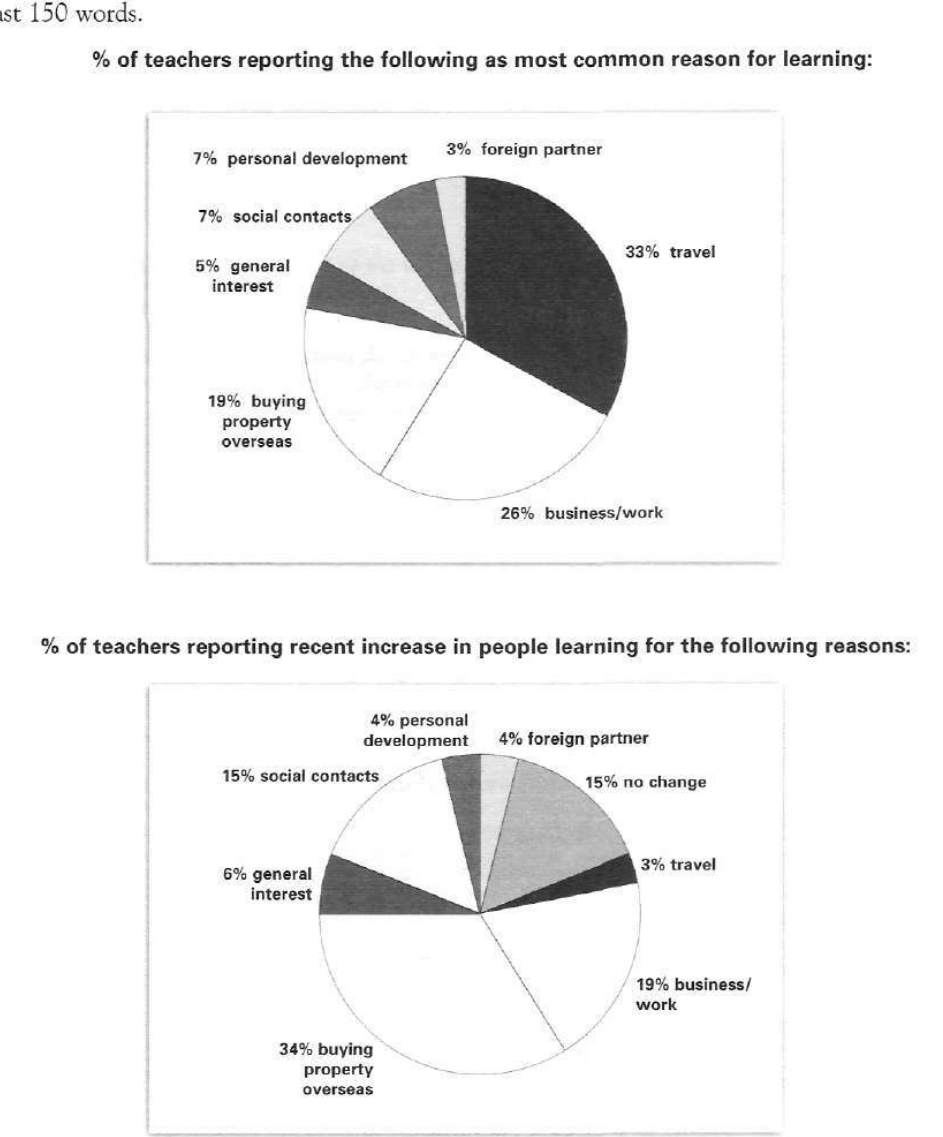
The pie charts below show responses by teachers of foreign languages in Britain to a survey concerning why their students are learning a foreign language. The first chart shows the main reason for learning a foreign language. The second chart shows how many teachers felt that there has been a recent change in the reason.
Write a report for a university lecturer describing the information below.
% of teachers reporting the following as most common reason for learning:
Student answer (Band 5.0)
The pie charts below that shows a behavior of tutor that demonstrate the abroad languages in Britain through survey why their students eager to learn languages. The first one illustrated the need of learning a language while second pie chart shows the changes that appear recently.
Firstly, the crucial factor for learning a foreign languages is travel which is 33 %, while some people's learn for business and work that shows a 26%. Moreover, 19 % humans want to learn abroad languages to buying a property overseas.The tutor explained that only 5% people show general interest in languages.3% learn languages for foreign partner.while social contact and personal development showed same percentages , which is 7%.
Secondly,the main reasons of learning languages recently is buying property overseas.whilen19% percent for business and work. There is a decline in the percentage of travel. While general interest is rise 2 %.Furthermore 15% shows no changes. From 7 to 15 %there is rise in social contacts.
AI examiner evaluation
| Criterion | Band |
|---|---|
| Task Achievement / Task Response | 5.0 |
| Coherence and Cohesion | 5.5 |
| Lexical Resource | 5.0 |
| Grammatical Range and Accuracy | 5.0 |
| Overall | 5.0 |
Task Achievement / Task Response: Band 5.0
You identify the leading reason in the first chart—travel at 33%—and report several other figures accurately, including business/work at 26%, overseas property at 19%, and social contacts and personal development at 7% each. However, the second chart is only partly described: you mention the 19% for business/work, 15% for no change, and the rise in social contacts, but omit the largest reported increase, buying property overseas at 34%, and do not give the figures for most other categories. The overview is also unclear because the charts show reasons teachers identify and reported recent increases, rather than simply “the main reasons” recently. Select the key contrasts and summarise them clearly before adding supporting figures.
Coherence and Cohesion: Band 5.5
The response has a basic two-part structure, using “Firstly” and “Secondly” to separate the charts, and the first paragraph generally moves through the categories in a readable order. However, there is no clear overview to guide the reader, and the second paragraph’s progression is less controlled: it moves from property to business, travel, general interest, no change, and social contacts without consistently explaining the comparisons. Some linking is awkward or incomplete, as in “There is a decline in the percentage of travel. While general interest is rise 2 %.” Use a concise overview, then group the most important figures, and connect comparisons in complete sentences rather than relying on isolated transitions.
Lexical Resource: Band 5.0
You use some relevant chart vocabulary, including “percentage,” “decline,” “rise,” and “social contacts,” so the reader can identify the general subject. However, word choice and collocation are often inaccurate or unnatural, which sometimes makes the meaning difficult to follow. For example, “a behavior of tutor” does not describe the survey findings, and “the need of learning” is less precise than language about reasons for learning. Phrases such as “some people's learn” and “19 % humans” are also unsuitable for an academic report. Aim for a small, accurate set of reporting expressions—such as “teachers cited,” “accounted for,” and “the proportion reporting an increase”—and use them consistently.
Grammatical Range and Accuracy: Band 5.0
The response attempts both simple and more extended sentences, and the reader can understand several comparisons. However, control is inconsistent, and errors in agreement, sentence construction, articles, and punctuation frequently interrupt the report. The opening, “The pie charts below that shows,” has faulty clause structure and subject–verb agreement; “the crucial factor … is travel which is 33%” also needs clearer sentence construction. Later, “general interest is rise 2%” uses an incorrect verb form, while fragments beginning “While” leave comparisons incomplete. Work first on accurate simple sentences with a clear subject and verb, then add complex clauses using correct forms such as “teachers reported that…” and “the figure rose from…to…”.
See this exact question answered at other band scores. The same prompt compared across bands.
Browse more IELTS Writing model answers or get your own writing scored by the same AI examiner.