Band 4.5 IELTS Writing Task 1 Model Answer
Overall Band Score: 4.5 · IELTS Complete Catalyst · 2026-11-18
IELTS Writing Task 1 question
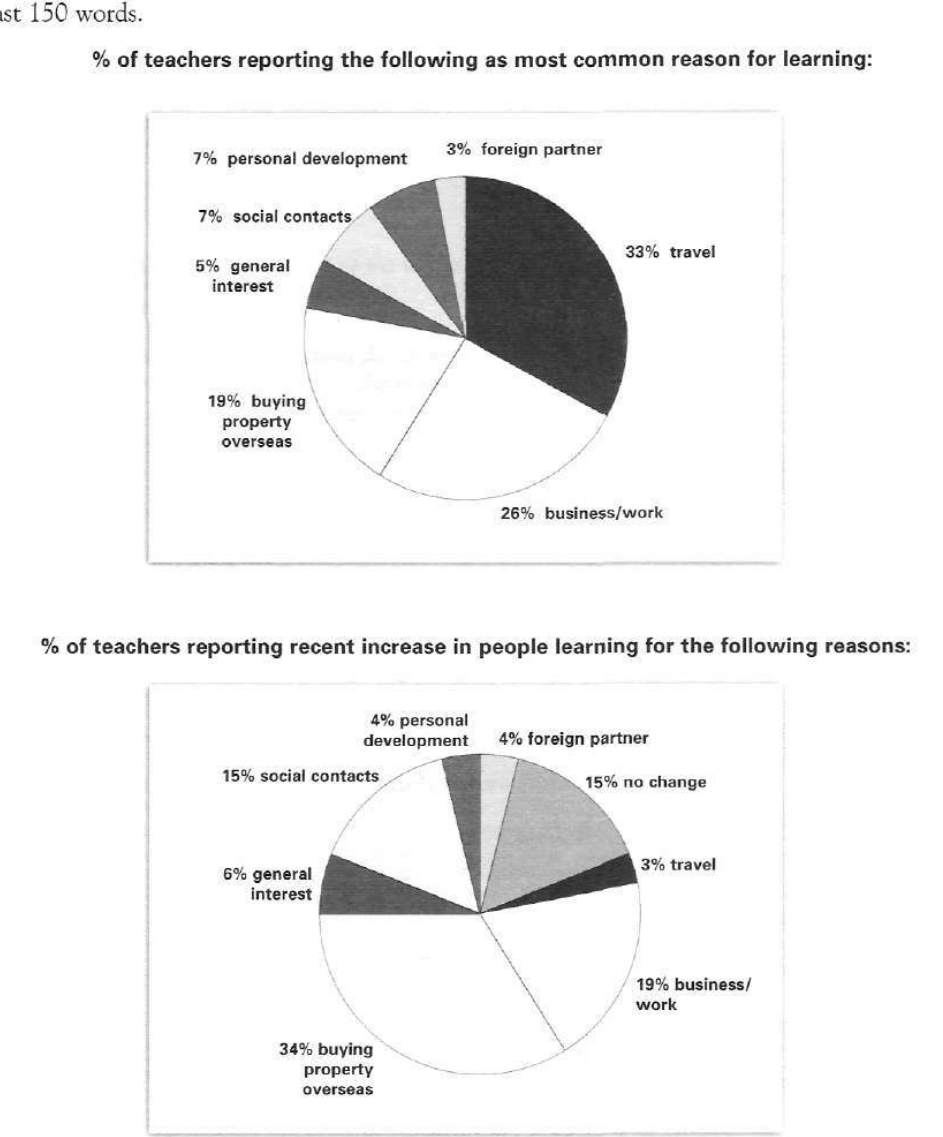
The pie charts below show responses by teachers of foreign languages in Britain to a survey concerning why their students are learning a foreign language. The first chart shows the main reason for learning a foreign language. The second chart shows how many teachers felt that there has been a recent change in the reason.
Write a report for a university lecturer describing the information below.
% of teachers reporting the following as most common reason for learning:
Student answer (Band 4.5)
The pie charts illustrate the responses by teachers of foreign laguages in Britian ti a survey why their students are learning a foreign language. The first chart illustrate the main reason for learning a foreign language. The second chart illustrate how many teachers felt that there has been a recent change in the reason.
Overall it is noticeable that learning language for buying property in foreign is risen from 19% to 34%, and learning language for travelling observed a sharp decline from 33% to 3%.
Learning foreign language for buissness or work is decrease because 26% before whereas recently there is only 19% learning foreign language for buissness/work. Recently 15% of people learning foreign language having no change in their life. Foreign partner rise about 1% , personal development learning decrese exactly 3%, social contacts people learning foreign language rise 8% rise and 15% recently and learning for social contacts rise 1% and recetly it is 6%.
AI examiner evaluation
| Criterion | Band |
|---|---|
| Task Achievement / Task Response | 4.5 |
| Coherence and Cohesion | 4.5 |
| Lexical Resource | 5.0 |
| Grammatical Range and Accuracy | 4.5 |
| Overall | 4.5 |
Task Achievement / Task Response: Band 4.5
You identify the two charts and include several relevant figures, including the leading reasons in the first chart and the 34% figure for property-related learning in the second. However, the overview misinterprets the charts: the second chart reports teachers’ views of recent changes, not a direct change from 19% to 34% in the same measure. The claim that travel fell from 33% to 3% makes the same comparison error. Several details are also inaccurate or unclear, such as saying social contacts rose by 8% and then by 1%; the chart gives 7% as the main reason and 15% reporting an increase. The response is 121 words, below the 150-word minimum. Add a clear overview and accurately explain what each chart measures.
Coherence and Cohesion: Band 4.5
The response has a basic structure: an introduction, an overview paragraph, and a paragraph of details. This gives the reader some sense of the report’s organisation. However, progression is weak because the overview compares figures from different charts as if they showed a direct rise or fall, and the final paragraph moves between categories without a clear sequence. The sentence beginning “Foreign partner rise about 1%” then shifts to personal development and social contacts, making the relationships between figures difficult to follow. Some linking is attempted through “Overall,” “whereas,” and “Recently,” but these links do not consistently clarify the data. Group the reasons in a logical order and use explicit references to distinguish the first chart from the second.
Lexical Resource: Band 5.0
You use relevant topic vocabulary such as “foreign language,” “business/work,” “personal development,” and “social contacts,” and the reader can generally identify the categories being discussed. However, the range is limited and several word choices or forms are inaccurate, including “learning language,” “buying property in foreign,” and “learning foreign language having no change in their life.” These expressions make some comparisons difficult to understand. Spelling errors such as “Britian,” “buissness,” and “recetly” also reduce accuracy. Aim for precise chart-reporting language, for example, “teachers reported,” “the proportion,” and “the most commonly cited reason.” Check spelling and use the chart’s category labels consistently.
Grammatical Range and Accuracy: Band 4.5
You attempt both simple and joined sentences, and the opening identifies the purpose of the charts. However, grammatical control is inconsistent, with frequent errors in verb forms, articles, and sentence construction. For example, “The first chart illustrate” needs subject–verb agreement, while “is risen” and “is decrease” use incorrect verb forms. In “Recently 15% of people learning foreign language having no change,” the sentence lacks a correctly formed main verb and has an unclear grammatical relationship between the ideas. The final sentence also becomes a run-on, with several clauses joined without clear punctuation. Use complete, shorter sentences and check agreement and tense; for example, “Teachers reported that travel was the most common reason in the first chart.”
See this exact question answered at other band scores. The same prompt compared across bands.
Browse more IELTS Writing model answers or get your own writing scored by the same AI examiner.