Band 5.5 IELTS Writing Task 1 Model Answer
Overall Band Score: 5.5 · IELTS Complete Catalyst · 2026-11-21
IELTS Writing Task 1 question
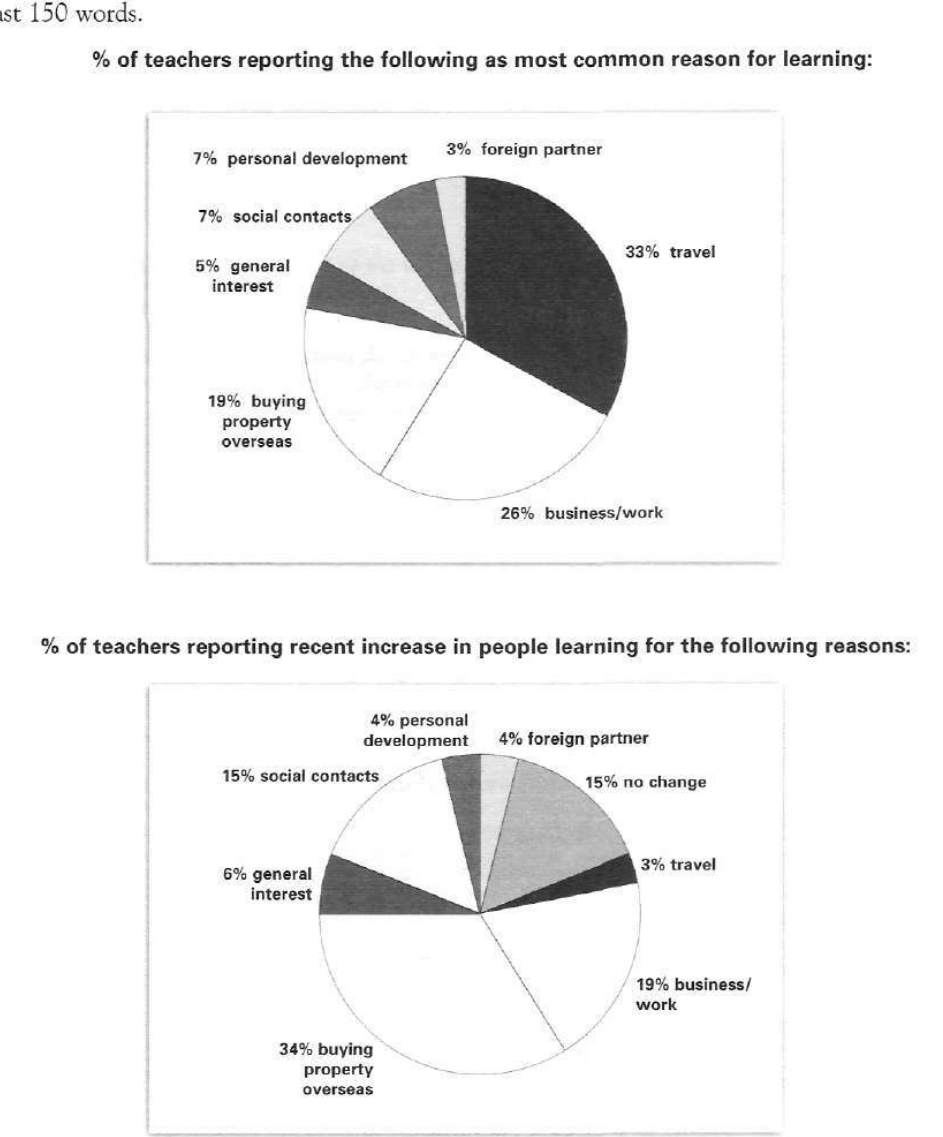
The pie charts below show responses by teachers of foreign languages in Britain to a survey concerning why their students are learning a foreign language. The first chart shows the main reason for learning a foreign language. The second chart shows how many teachers felt that there has been a recent change in the reason.
Write a report for a university lecturer describing the information below.
% of teachers reporting the following as most common reason for learning:
Student answer (Band 5.5)
There are two pie charts demonstrating the reason of students learning foreign language. The main difference in these two pie chart is that the first one is showing the exact main reason of students learning foreign language whereas the second one describes the point of view of teachers in the recent change in the reason.
The first chart illustrates that the 33% of the students learn foreign language to travel meanwhile 26% of the students main reason is buisness and work. 19% wants to buy property overseas. The rest of the students reason is general interest, social contacts, personal development and foreign partner.
However, the teachers felt change in their reasons in second pie chart. Now, the 34% of student wants to learn foreign language to buy property overseas and 19% of students reason is work/buisness. There is huge change in travel where most of the students main reason was to travel had now become a least option. The rest of the students reason are social contacts, no change, general interest, personal development and foriegn partner.
AI examiner evaluation
| Criterion | Band |
|---|---|
| Task Achievement / Task Response | 5.0 |
| Coherence and Cohesion | 5.5 |
| Lexical Resource | 5.5 |
| Grammatical Range and Accuracy | 5.5 |
| Overall | 5.5 |
Task Achievement / Task Response: Band 5.0
You identify the charts’ general subjects and report several key figures accurately: travel is the leading main reason at 33%, followed by business/work at 26%, while buying property overseas is the largest reported recent increase at 34%. However, the response only partly fulfils the reporting task because it lacks a clear overview of the main contrasts and leaves several categories without figures. The second chart is also misinterpreted: it reports teachers’ views of recent increases, not students’ current reasons, so “Now, the 34% of student wants…” presents the data as a new distribution of reasons. In addition, travel is the smallest increase at 3%, but calling it “a least option” is unclear. Summarise the overall pattern and compare the two charts precisely.
Coherence and Cohesion: Band 5.5
The response has a basic, understandable structure: an introduction is followed by a paragraph on each chart, and phrases such as “The first chart” and “However” help signal movement between points. This gives the report some organisation. However, progression within the paragraphs is limited: the first chart’s smaller categories are grouped together without values, and the final paragraph similarly lists categories rather than explaining their relative importance. “However” does not express a clear contrast between the charts, and “The rest” is repeated without useful referencing. A clearer overview paragraph, followed by focused comparisons supported by figures, would make the information easier to follow and reduce the list-like effect.
Lexical Resource: Band 5.5
You use some relevant topic vocabulary, including “main reason,” “recent change,” “business and work,” and “buy property overseas,” so the subject is generally clear. There is also an attempt to vary wording with “illustrates” and “describes.” However, several phrases are awkward or imprecise, such as “the reason of students learning,” “felt change in their reasons,” and “a least option.” These choices sometimes make the intended comparison difficult to understand. Spelling errors in “buisness” and “foriegn” also reduce accuracy. Aim for standard report collocations and precise terms for what the second chart measures; for example, describe teachers reporting an increase rather than saying students’ reasons have changed.
Grammatical Range and Accuracy: Band 5.5
You attempt a mixture of simple statements and longer sentences, including a contrast introduced by “whereas” and a sentence beginning “There is huge change in travel.” Meaning is usually recoverable, but errors in sentence structure, agreement, articles, and verb forms are frequent enough to affect clarity. For example, “The main difference in these two pie chart is” has number and agreement problems, while “19% wants” does not agree with the percentage as a plural group. The construction “had now become a least option” is also grammatically unclear, and several sentences omit articles or use awkward clause patterns. Practise accurate plural subjects and consistent tense, and build longer sentences around one clear comparison at a time.
See this exact question answered at other band scores. The same prompt compared across bands.
Browse more IELTS Writing model answers or get your own writing scored by the same AI examiner.