Band 5.0 IELTS Writing Task 1 Model Answer
Overall Band Score: 5.0 · IELTS Complete Catalyst · 2026-11-22
IELTS Writing Task 1 question
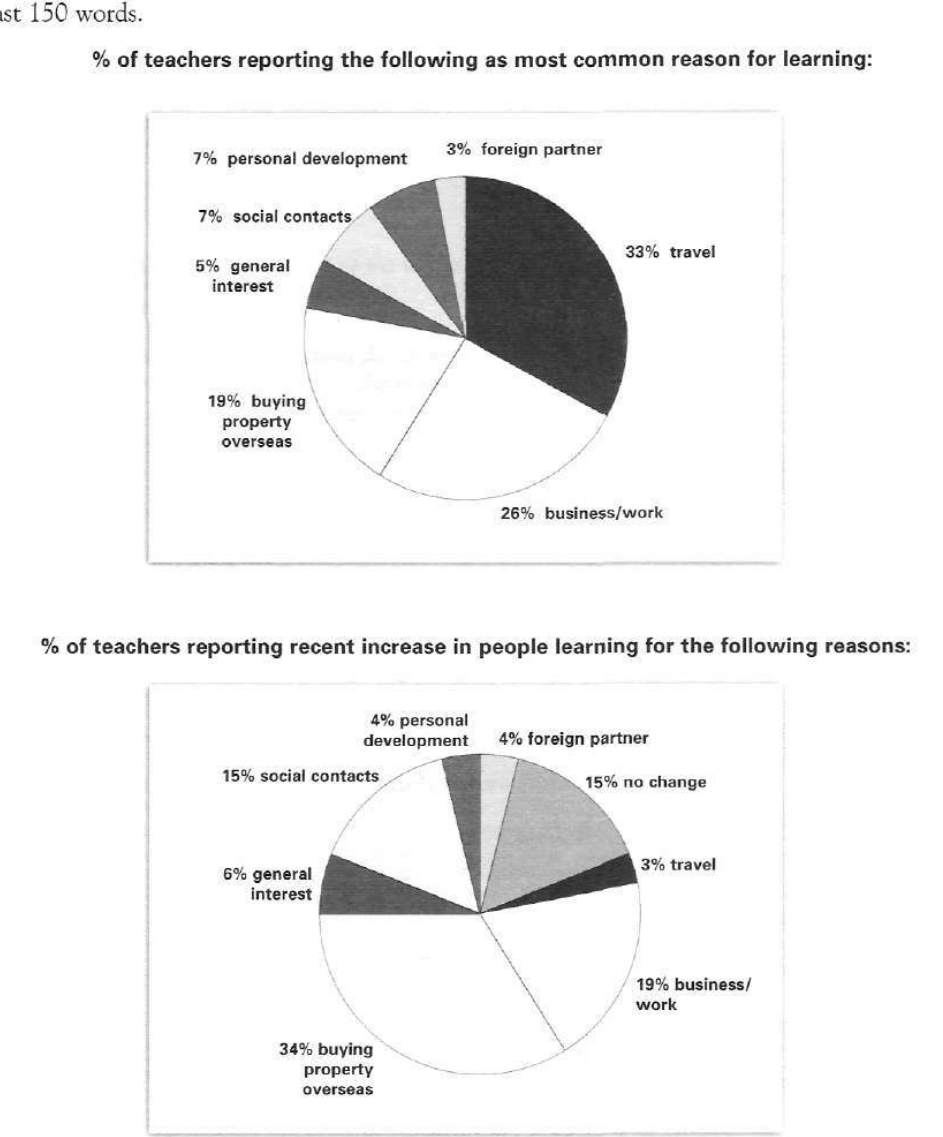
The pie charts below show responses by teachers of foreign languages in Britain to a survey concerning why their students are learning a foreign language. The first chart shows the main reason for learning a foreign language. The second chart shows how many teachers felt that there has been a recent change in the reason.
Write a report for a university lecturer describing the information below.
% of teachers reporting the following as most common reason for learning:
Student answer (Band 5.0)
"The first chart illustrates the highlight reason of foreign langauges in learning english.
The second pie chart illustrates how many teachers realise that there has been a
previous change in the reason of foreign language.
Overall,in the first pie chart the travel of foreign langauge highest proprtion accounted
for 33%.The foreign partner proportion of 3% lowest.
The business/work proportion of 26%.
Buying property overseas proportion of 19%.
In personal development and social contacts represented of 7%were remained
same.The people use foreign languages in general interest 5%.
Another pie chart shows how much changes in previous years of learning english.
Overall,the learning english in buying property overseas accounted for 34%highest.
The learning people of travel proportion of 3%lowest.
The personal development and foreign partner remains same 4%in previous changes in
people learning.
However,buying property overseas made up 34%.
The socal contacts proportion of 15%.
The business/work in learning english represented of 19%.
Finally,the general interest accounted for 6%."
AI examiner evaluation
| Criterion | Band |
|---|---|
| Task Achievement / Task Response | 5.0 |
| Coherence and Cohesion | 4.5 |
| Lexical Resource | 5.0 |
| Grammatical Range and Accuracy | 4.5 |
| Overall | 5.0 |
Task Achievement / Task Response: Band 5.0
You identify several key figures accurately: travel is the leading first-chart reason at 33%, foreign partners are lowest at 3%, and buying property overseas is the largest reported increase at 34%. However, the report only partly fulfils the task because it gives a list of figures rather than a clear comparison of what the two charts measure. The second chart concerns teachers’ reports of recent increases, but the response calls this a “previous change” and does not explain the 15% “no change” category. Some details are also unclear: “remained same” is not supported by the first chart, which gives separate shares for personal development and social contacts. A concise overview contrasting the leading reasons in each chart, followed by accurate comparisons, would make the response more complete.
Coherence and Cohesion: Band 4.5
The response has separate sections for the two charts and uses “Overall” and “Finally” to signal some organisation. This helps the reader recognise the broad sequence. However, progression within each section is weak: most sentences simply name a category and its percentage, with little grouping or comparison. The repeated “Overall” paragraphs do not provide a clear synthesis, and the second chart’s figures are presented in a scattered order, with buying property overseas repeated. Connections such as “In personal development and social contacts represented…” are difficult to follow, while the opening description is split across an awkward line break. Grouping the largest, smallest and remaining categories, and using clear comparison links, would create a more coherent report.
Lexical Resource: Band 5.0
You use relevant chart vocabulary, including “proportion,” “accounted for,” and “represented,” and the category labels generally make the subject recognisable. However, the range is limited and several word choices or collocations are inaccurate, which sometimes makes the meaning difficult to interpret. For example, “highlight reason” is not a natural way to describe the main reason, “previous change” misrepresents a recent increase, and “the travel of foreign language highest proportion” is unclear. There are also spelling errors such as “langauges” and “socal.” Aim for precise reporting phrases and use the chart’s wording consistently—for example, “the most common reason” and “teachers reporting an increase.”
Grammatical Range and Accuracy: Band 4.5
Most sentences are short and follow a repetitive pattern, so there is little evidence of a range of sentence structures. Frequent errors in sentence formation and agreement make several statements hard to understand. For instance, “In personal development and social contacts represented of 7%were remained same” lacks a clear grammatical structure, while “The business/work proportion of 26%” is a fragment rather than a complete sentence. The opening also has an incomplete construction: “The second pie chart illustrates how many teachers realise that there has been a…” A few simple statements, such as “The general interest accounted for 6%,” are more understandable, but the report needs consistently complete sentences. Practise forming sentences with a clear subject and verb, and check articles, agreement and punctuation.
See this exact question answered at other band scores. The same prompt compared across bands.
Browse more IELTS Writing model answers or get your own writing scored by the same AI examiner.