Band 5.5 IELTS Writing Task 1 Model Answer
Overall Band Score: 5.5 · IELTS Complete Catalyst · 2026-11-22
IELTS Writing Task 1 question
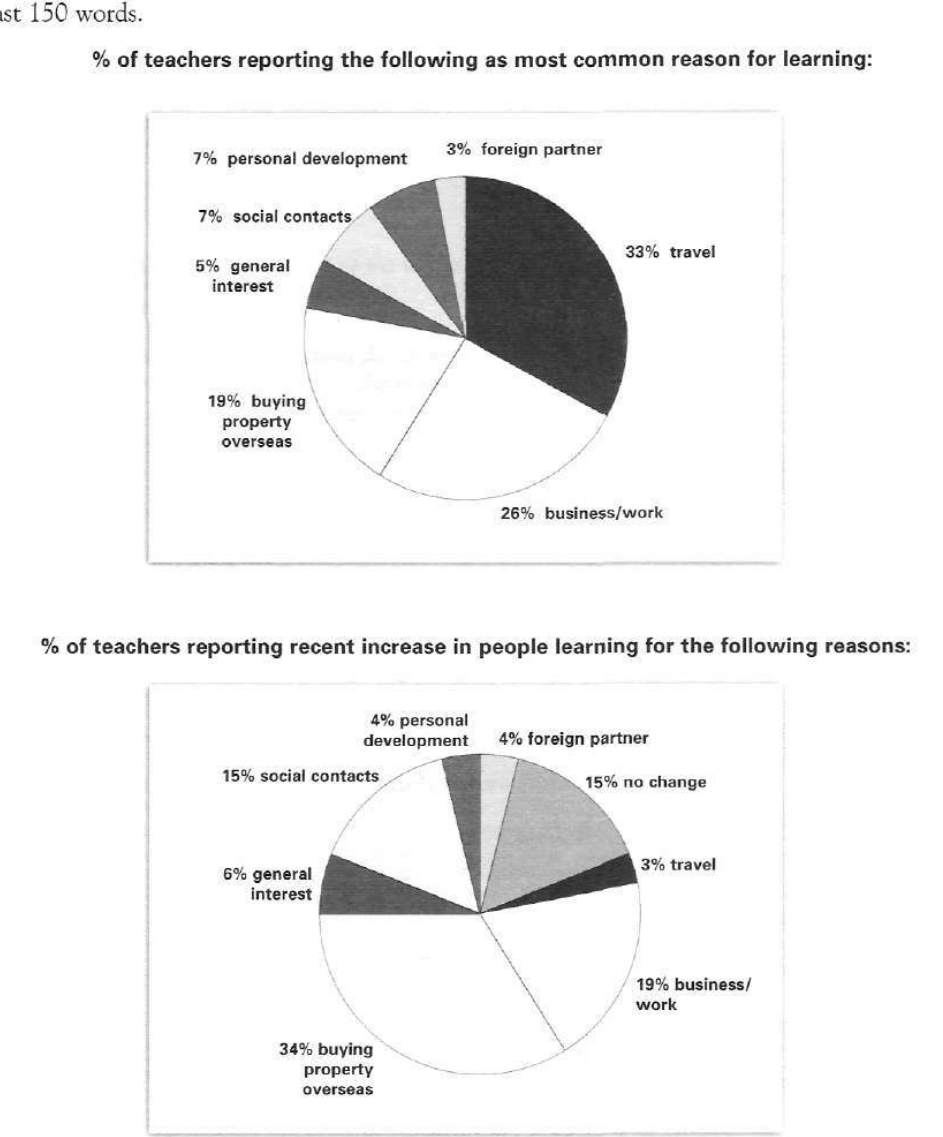
The pie charts below show responses by teachers of foreign languages in Britain to a survey concerning why their students are learning a foreign language. The first chart shows the main reason for learning a foreign language. The second chart shows how many teachers felt that there has been a recent change in the reason.
Write a report for a university lecturer describing the information below.
% of teachers reporting the following as most common reason for learning:
Student answer (Band 5.5)
To whom it may concern,there is a display of pie charts showing percentages reporting common reasons for learning foreign languages and also the display of percentages showing rise in the number of people learning new languages.
So,as shown in first one there is a highest percentage of upto 33% of people who just need to travel thats why they learn foreign language and the people wanted to do bussiness abroad,almost 26% of them are learning.To those who are buying property somewhere outside there country they are almost 19% approximately.People like having general interest in languages,having social contacts,some having personal developments and for those having foreign partners the figures are 5%,7%,7% and 3% respectively.
If we talk about recent survay,fluctuations can be observed in the number of people learning foreign languages.For those buying properties escalation can be seen from 19% to 34% that quiet appreciable.For travelling,huge reduction of figures are observed from 33% to 3% only.For bussiness,foreign partners,general interest and having social contacts are 19%,4%,6% and 15% respectively.Some other terms also displayed like 4% for personal development and 15% for no change.
AI examiner evaluation
| Criterion | Band |
|---|---|
| Task Achievement / Task Response | 5.5 |
| Coherence and Cohesion | 6.0 |
| Lexical Resource | 5.5 |
| Grammatical Range and Accuracy | 5.0 |
| Overall | 5.5 |
Task Achievement / Task Response: Band 5.5
You cover both charts and identify several important figures accurately: travel is the leading initial reason at 33%, followed by business/work at 26%, while buying property overseas is associated with the largest reported increase at 34%. However, the report lacks a clear overview that summarises the main contrast between the charts. The second chart is also misinterpreted: its figures describe teachers reporting a recent increase, not a direct change from the first chart, so saying travel fell “from 33% to 3%” is not supported. The 15% “no change” category is included, but the meaning of the other percentages could be explained more clearly. A concise overview and accurate framing of the second chart would make the response more complete.
Coherence and Cohesion: Band 6.0
The response has a generally understandable sequence: it first describes the main reasons and then turns to the recent-increase chart. Phrases such as “as shown in first one” and “If we talk about recent survey” help signal this shift, and the figures are mostly grouped by chart. However, the opening is an unsuitable letter-style salutation, and the report is presented as one continuous block rather than clearly organised paragraphs. Some links are mechanical or unclear, particularly “For those buying properties escalation can be seen” and “Some other terms also displayed.” Use a brief introduction, a separate overview, and focused detail paragraphs, with clearer references to what each chart measures.
Lexical Resource: Band 5.5
You use relevant topic vocabulary, including “percentages,” “foreign partners,” “personal development,” and “fluctuations,” so the reader can follow the subject. There are also attempts at more formal reporting language, such as “escalation” and “appreciable.” However, several choices are inaccurate or awkward: “people who just need to travel thats why they learn” is conversational, while “fluctuations” suggests variation over time that the chart does not show. Spelling errors such as “bussiness” and “survay,” along with phrases like “outside there country,” reduce precision. Aim for standard chart-reporting collocations such as “the proportion of teachers reporting” and “the most commonly cited reason.”
Grammatical Range and Accuracy: Band 5.0
You attempt some longer sentence structures, for example when listing the reasons and their percentages, and the overall meaning is usually recoverable. However, control is inconsistent, and several sentences contain faulty or incomplete constructions. “To those who are buying property somewhere outside there country they are almost 19%” has an unclear subject and awkward clause structure; “For business, foreign partners, general interest and having social contacts are…” also lacks a clear grammatical frame. Articles, agreement, and punctuation need attention, including the run-on opening “To whom it may concern,there is…” and missing spaces after commas. Build shorter, complete sentences first, then add complex clauses only when their relationships are clear.
See this exact question answered at other band scores. The same prompt compared across bands.
Browse more IELTS Writing model answers or get your own writing scored by the same AI examiner.