Band 5.5 IELTS Writing Task 1 Model Answer
Overall Band Score: 5.5 · IELTS Complete Catalyst · 2026-11-22
IELTS Writing Task 1 question
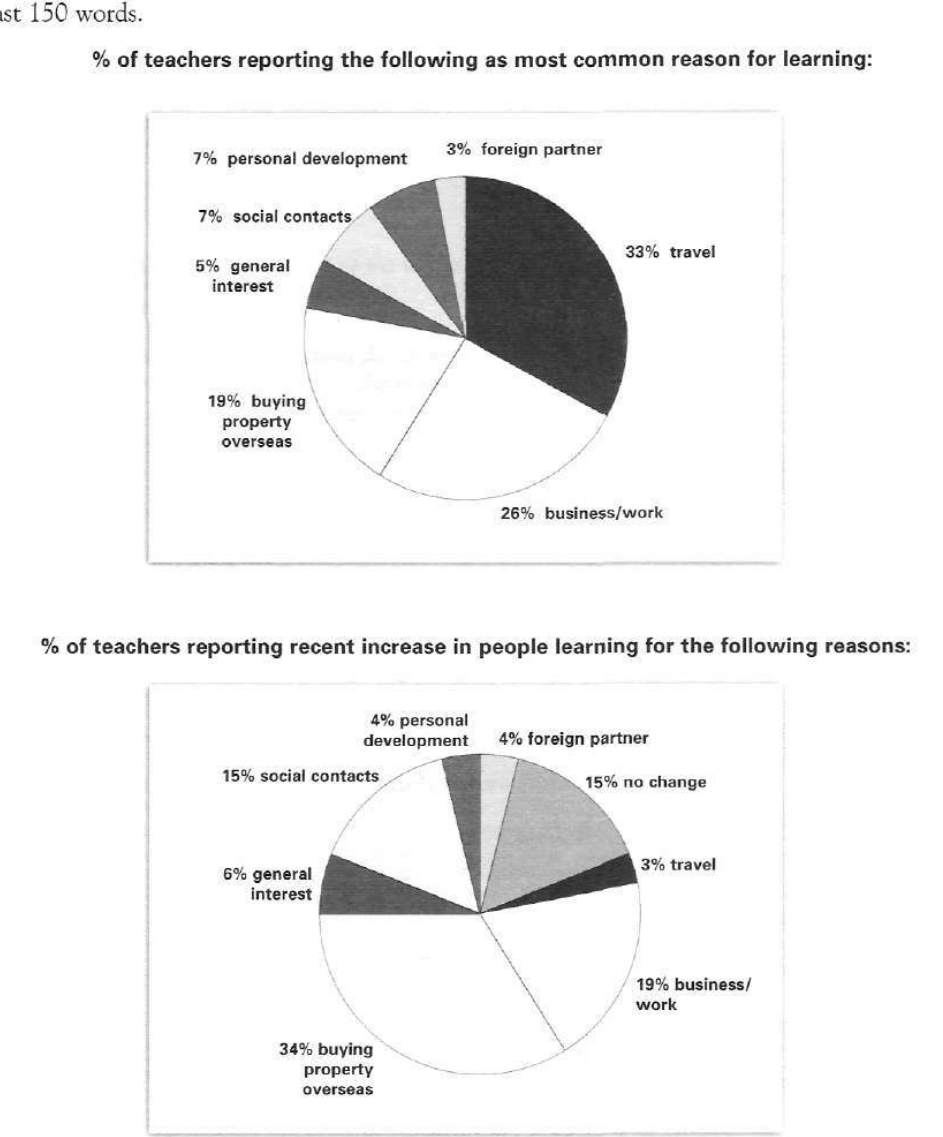
The pie charts below show responses by teachers of foreign languages in Britain to a survey concerning why their students are learning a foreign language. The first chart shows the main reason for learning a foreign language. The second chart shows how many teachers felt that there has been a recent change in the reason.
Write a report for a university lecturer describing the information below.
% of teachers reporting the following as most common reason for learning:
Student answer (Band 5.5)
the pie charts illustrates students reasons to learn a foreign language , those answers extracted from teachers in a cause of survey concerning about why students are adapting and learn new lnaguage.
overall, both charts are split in 2 parts , first one revealing the main common goal for students in learning new language while two main are travel and business or work , in the other hand the second chart showing a recent rose in buying property overseas and social contacts .
furthermore , the main reason in learning a foreign langauge in first study pie chart is travel with 33% , going under to 26% in business and work , while holding between 3% to 19% in personal intressets like bying property and personal devolpment .
moreover , in second pie chart there is changes in students responses with slightly increase in bying property overseas from 19% blowing up to 34% , in social contacts there been a noticable increase from 7% to 15% , for the rest are in high and lows some of answers stay same as the first one .
AI examiner evaluation
| Criterion | Band |
|---|---|
| Task Achievement / Task Response | 6.0 |
| Coherence and Cohesion | 6.0 |
| Lexical Resource | 5.5 |
| Grammatical Range and Accuracy | 5.0 |
| Overall | 5.5 |
Task Achievement / Task Response: Band 6.0
You identify the main pattern in the first chart accurately: travel is the leading reason at 33%, followed by business/work at 26%, and you highlight the rise in property-related learning from 19% to 34% in the second chart. This gives the report relevant coverage of both charts. However, some details are unclear or incomplete: the second chart reports teachers’ views of recent increases, not simply changes in students’ responses, and “some answers stay same” is inaccurate because the chart’s 15% “no change” category is separate from the reasons. Several first-chart categories are grouped vaguely as “personal interests,” and the overview could compare the charts more precisely. Include key figures for social contacts and business/work in the second chart, and distinguish the chart’s categories clearly.
Coherence and Cohesion: Band 6.0
The response has a recognisable overall structure: an introduction, an overview, and paragraphs describing the two charts. Linking expressions such as “overall,” “furthermore,” and “moreover” help signal movement between points. However, progression within sentences is sometimes difficult to follow, particularly in “while holding between 3% to 19% in personal interests,” where several categories are compressed together. The contrast marker “in the other hand” is also used awkwardly, and the final sentence combines several ideas without clearly separating them. Use one paragraph per chart after a concise overview, and connect comparisons directly—for example, state the first-chart figure, then its corresponding second-chart figure. Clearer referencing would make the report easier to follow.
Lexical Resource: Band 5.5
You attempt a range of task-related vocabulary, including “main reason,” “recent rise,” “business or work,” and “social contacts,” and the reader can generally understand the intended comparisons. However, spelling and word-choice errors are frequent enough to reduce precision: “lnaguage,” “langauge,” “intressets,” “bying,” and “devolpment” obscure otherwise relevant information. Some phrases are also unnatural or imprecise, such as “answers extracted from teachers in a cause of survey” and “going under to 26%.” Aim for accurate, conventional chart-report language and check spelling carefully. More precise terms such as “accounted for,” “increased to,” and “the proportion reporting” would help you describe the data clearly without relying on vague expressions.
Grammatical Range and Accuracy: Band 5.0
You attempt both simple statements and longer sentences with comparisons, including “the main reason … is travel with 33%, going under to 26% in business and work.” However, control of sentence structure is limited, and errors sometimes make relationships between ideas unclear. For example, “the pie charts illustrates” has a subject–verb agreement error, while “there been a noticable increase” is missing an auxiliary verb. The opening sentence also lacks a clear grammatical structure, and several clauses are joined without reliable punctuation. Practise accurate subject–verb agreement, articles, and complete clause construction. Shorter sentences with one clear comparison each would improve accuracy while still allowing you to use some complex structures.
See this exact question answered at other band scores. The same prompt compared across bands.
Browse more IELTS Writing model answers or get your own writing scored by the same AI examiner.