Band 5.5 IELTS Writing Task 1 Model Answer
Overall Band Score: 5.5 · Cambridge IELTS 21 · 2026-11-05
IELTS Writing Task 1 question
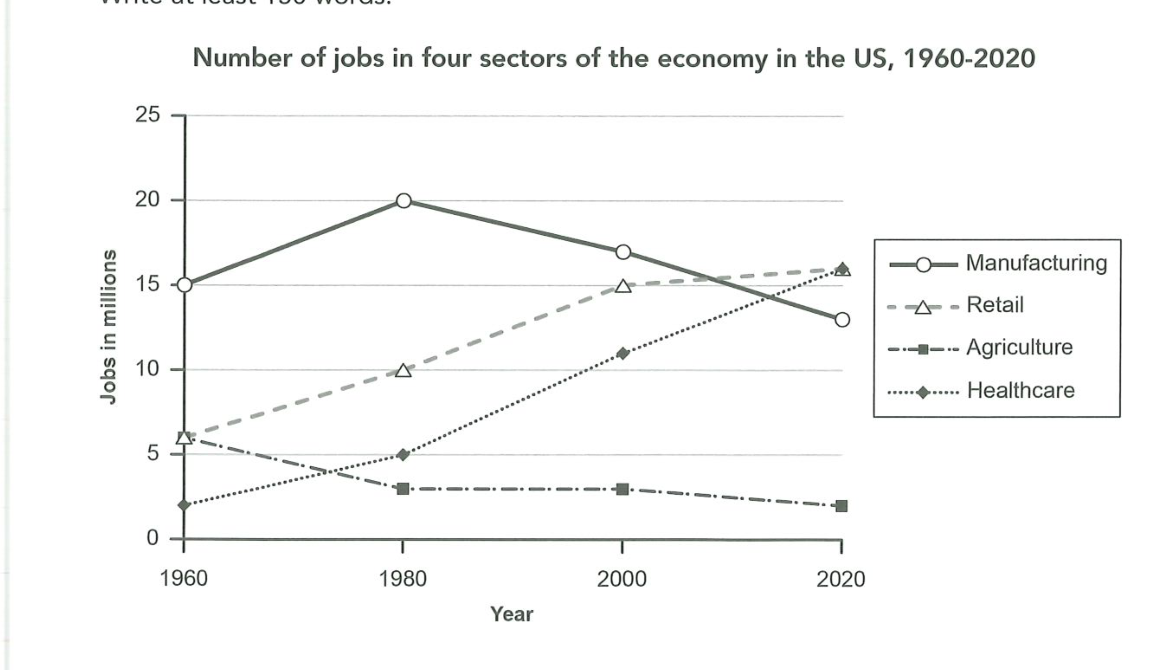
The graph below gives information about the number of jobs in four sectors of the economy in the US between 1960 and 2020.
Summarise the information by selecting and reporting the main features, and make comparisons where relevant.
Number of jobs in four sectors of the economy in the US, 1960-2020
Student answer (Band 5.5)
THE GIVEN LINE GRAPH ILLUSTRATES THE NUMBER OF SEATS FOR EMPLOYEES IN FOUR SECTORS OF THE BUDGET IN THE USA FROM 1960 TO 2020.
OVERALL,IN THE BEGINNING, THE JOBS IN THE MANUFACTURING SECTORS ARE AT HIGH POSITION THAN OTHERS BUT WITH THE TIME IT DECREASED, WHILE THE AGRICULTURE SECTOR MAINTAINED LOW POSITION.
IN 1960,THE JOBS IN THE MANUFACTURING SECTOR WAS 15 MILLIONS WHILE IN 1980,IT WAS ABOUT 20 MILLIONS.AFTER 1980,IT WAS A SHARP DECLINE AND IN 2020,IT WAS ABOUT 13 MILLIONS.THE JOBS IN THE RETAIL SECTOR WAS ABOUT 7 MILLION AND IN 1980, IT WAS SHARP INCREASE AND WAS ABOUT EQUAL TO 10 MILLIONS.AFTER 1980,A GRADUAL RISE IN IT AND IN 2020,IT WAS MORE THAN 15 MILLIONS APPROXIMATELY 16 MILLIONS.
FOLLOWED THIS,IN 1960,THE JOBS IN AGRICULTURE SECTOR WAS ABOUT MORE THAN 5 MILLIONS.AFTER 1960,IT WAS STEADY DECREASE IN THIS FIELD AND WAS ABOUT LESS THAN 5 MILLIONS.AFTER 1980,IT REMAINED CONSTANT TO 2000 BUT A GRADUAL DECLINE AFTER IT AND REMAINED ABOUT 2 MILLIONS.THE EMPLOYMENT IN HEALTHCARE SECTOR WAS ROUGHLY 2 MILLIONS IN 1960.AFTER 1960,A STEADY RISE IN THIS SECTOR AND WAS ABOUT 16 MILLIONS IN 2020 AND HAD A GREAT PROGRESS IN THIS ERA.
AI examiner evaluation
| Criterion | Band |
|---|---|
| Task Achievement / Task Response | 6.0 |
| Coherence and Cohesion | 6.0 |
| Lexical Resource | 5.5 |
| Grammatical Range and Accuracy | 5.0 |
| Overall | 5.5 |
Task Achievement / Task Response: Band 6.0
You identify the main broad patterns: manufacturing starts as the largest sector and then declines, agriculture remains the smallest, and healthcare rises substantially. Several figures are also reported accurately, including manufacturing at 15 million in 1960 and 20 million in 1980, and healthcare reaching about 16 million by 2020. However, the overview is incomplete: it does not mention that retail and healthcare both finish at around 16 million, jointly the highest figures. Some details are imprecise or unclear, such as retail being about 7 million in 1960 rather than 6, and the description of manufacturing’s post-1980 fall as “sharp” without distinguishing its gradual decline across the later points. A clearer overview and more precise comparisons would strengthen the report.
Coherence and Cohesion: Band 6.0
The response has a recognisable structure, moving from an introduction and overview to details about the four sectors. Grouping manufacturing and retail before agriculture and healthcare also gives the reader a workable route through the data. However, progression within the paragraphs is sometimes mechanical: repeated transitions such as “After 1960” and “After 1980” make the account sound like a sequence of notes rather than a connected comparison. Some links are unclear, particularly “Followed this,” and the overview’s “with the time it decreased” does not clearly identify what “it” refers to. Use fewer formulaic time markers and connect related trends directly—for example, contrast the decline in manufacturing with the rise in retail and healthcare. This would make the overall organisation more fluent.
Lexical Resource: Band 5.5
You use relevant topic vocabulary, including “manufacturing sector,” “gradual rise,” “steady decrease,” and “remained constant,” so the main trends are generally understandable. There is some attempt to vary descriptions of change, but several word choices and collocations are inaccurate or unnatural. “Number of seats for employees” does not describe jobs, while “sectors of the budget” misidentifies the economic sectors. Phrases such as “at high position,” “sharp increase,” and “great progress” are also unsuitable or imprecise for describing this graph. Aim for standard data-reporting expressions such as “employment,” “stood at,” “rose steadily,” and “declined.” More accurate collocations would make your descriptions clearer and more appropriately formal.
Grammatical Range and Accuracy: Band 5.0
You attempt to combine information using time clauses and contrast, and the reader can usually follow the intended trends. However, control of basic sentence grammar is inconsistent. For example, “the jobs … was 15 millions” has subject–verb agreement and number errors, while “After 1980, it was a sharp decline” uses an incorrect sentence pattern. Several clauses are incomplete or awkwardly joined, as in “After 1960, a steady rise in this sector and was about 16 millions.” Articles and punctuation are also inconsistent, with missing spaces after commas and frequent all-capital text. Practise complete subject–verb sentences and accurate past-tense reporting, such as “Employment in healthcare rose steadily and reached about 16 million in 2020.”
See this exact question answered at other band scores. The same prompt compared across bands.
Browse more IELTS Writing model answers or get your own writing scored by the same AI examiner.