Band 6.0 IELTS Writing Task 1 Model Answer
Overall Band Score: 6.0 · Cambridge IELTS 21 · 2026-11-06
IELTS Writing Task 1 question
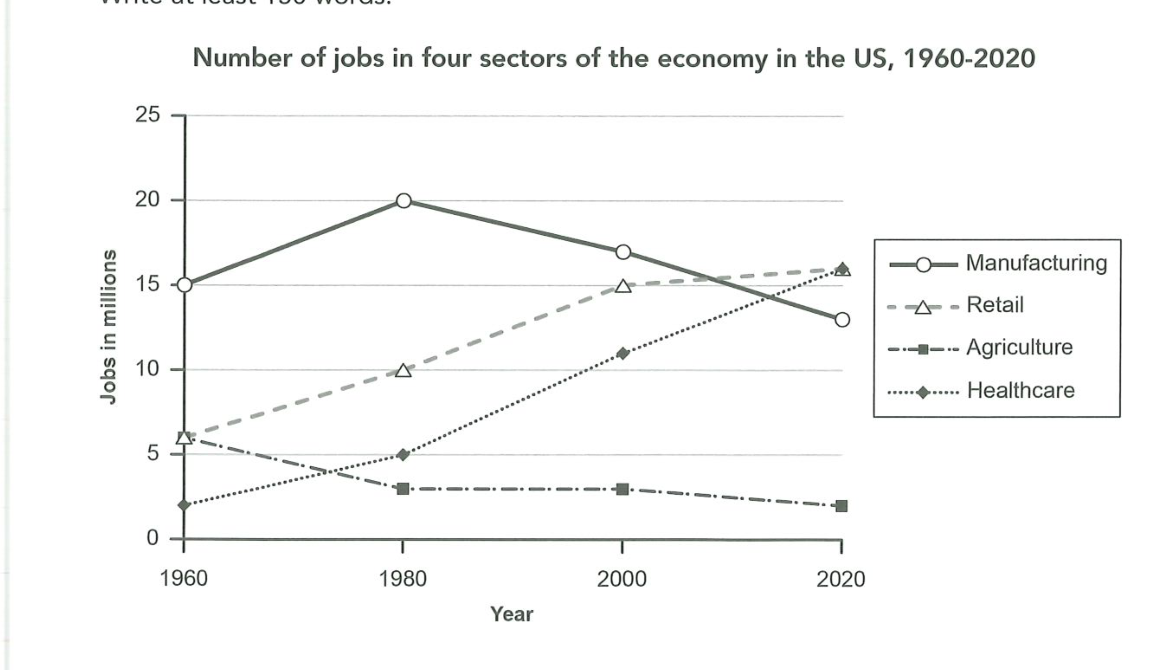
The graph below gives information about the number of jobs in four sectors of the economy in the US between 1960 and 2020.
Summarise the information by selecting and reporting the main features, and make comparisons where relevant.
Number of jobs in four sectors of the economy in the US, 1960-2020
Student answer (Band 6.0)
The number of jobs in the four sectors of economy from [redacted phone] as shown in the graph.
The four sectors mentioned above in the graph are Manufacturing,Retail,Agriculture and Healthcare.To make the above discription easy let us divide the time period in four different parts
1. [redacted phone]
The time period from [redacted phone].We can clearly se the dominance of manufacturing sector in jobs and the boom in manufacturing,retail and healthcare sector but a decrease in agriculture sector.The stats showing the increase in maufacturing was of 5 million jobs,in retail it was about 4 million and in healthcare it was about 3 million whereas the decrease was of 4 million in agriculture sector
2. [redacted phone]
Unfortunately this time the case was different for the manufacturing sector.The tables have turned and the manufacturing sector faced a decreas of over 3 million jobs whereas the retail and the healthcare were doing steadily good and had an another increase in 5 million jobs each sector.On the other hand the agriculture sector was on a still phase.There are no changes seen on the graph for the agriculture sector.
3 [redacted phone]
The last and final stage.This time the retail and healthcare sectors have crossed the manufacturing sector and reached on the top of the table.manufacturing sector again faced a loss of about 4 million jobs on the other hand retail and healthcare sector have been come up with an increase 2 and 4 million.There are no such fluctuations in the graph of agriculture sector.
This was all about the rise and fall of different sectors.Initially manufacturing sector was leading but the continous loss of jobs in manufacturing sector and the steady rise of retail and healthcare sectors the graphs have been changed but for agriculture it was almost same along the time period
AI examiner evaluation
| Criterion | Band |
|---|---|
| Task Achievement / Task Response | 6.5 |
| Coherence and Cohesion | 6.0 |
| Lexical Resource | 5.5 |
| Grammatical Range and Accuracy | 5.5 |
| Overall | 6.0 |
Task Achievement / Task Response: Band 6.5
You identify the main shifts across the period: manufacturing peaks in 1980 and then declines, retail and healthcare rise, and agriculture falls or remains broadly stable. Your final comparison that retail and healthcare overtake manufacturing by 2020 is a useful overview, and most reported changes are close to the chart. However, the overview is delayed until the end, and some comparisons are imprecise: agriculture falls from 6 to 3 million between 1960 and 1980, not 4 million, while healthcare rises by 3 million in that period, not approximately 3 only if read as a rough figure. The claim that retail and healthcare both reach “the top” overlooks that they tie at about 16 million in 2020. A concise opening overview and more exact comparisons would make the key features clearer and more fully developed.
Coherence and Cohesion: Band 6.0
The response has a clear chronological structure, with separate sections for 1960–1980, 1980–2000 and 2000–2020, followed by a concluding summary. This makes the sequence of changes easy to follow, and phrases such as “On the other hand” help signal contrasts. However, the numbered, report-like format and repeated openings such as “This time” and “The last and final stage” make the progression somewhat mechanical. The introduction mainly restates the chart title rather than presenting an overview, so the reader has to wait until the final paragraph for the main pattern. Some links between clauses are also awkward, particularly “but for agriculture it was almost same.” Grouping the trends by rising, falling and stable sectors could create a more natural comparison.
Lexical Resource: Band 5.5
You use a relevant range of trend vocabulary, including “dominance,” “decrease,” “faced a loss,” “steady rise” and “fluctuations,” so the main movements are generally understandable. There are also attempts at more descriptive phrasing, such as “the tables have turned.” However, several choices are informal or imprecise for an academic report: “doing steadily good,” “on a still phase” and “top of the table” do not describe the data naturally. Spelling errors such as “discription,” “maufacturing” and “continous” also reduce accuracy. Aim for standard collocations such as “remained stable” and “employment increased,” and check spelling carefully. This would make your vocabulary more precise and consistently appropriate to the task.
Grammatical Range and Accuracy: Band 5.5
You attempt both simple and more complex sentences, including contrasts with “whereas” and “on the other hand,” and the overall meaning is usually clear. Some sentence forms are nevertheless incomplete or awkward, for example, “The time period from 1960-1980” and “There are no changes seen on the graph.” Tense and agreement also need attention: “retail and healthcare sector have been come up” is not a correct verb construction, and “the graphs have been changed” does not accurately express the trend. Punctuation and sentence boundaries are inconsistent, especially in the opening and numbered sections. Use complete sentences, maintain past tense when describing the historical data, and review subject–verb agreement and verb forms to improve control.
See this exact question answered at other band scores. The same prompt compared across bands.
Browse more IELTS Writing model answers or get your own writing scored by the same AI examiner.