Band 4.5 IELTS Writing Task 1 Model Answer
Overall Band Score: 4.5 · Cambridge IELTS 21 · 2026-11-19
IELTS Writing Task 1 question
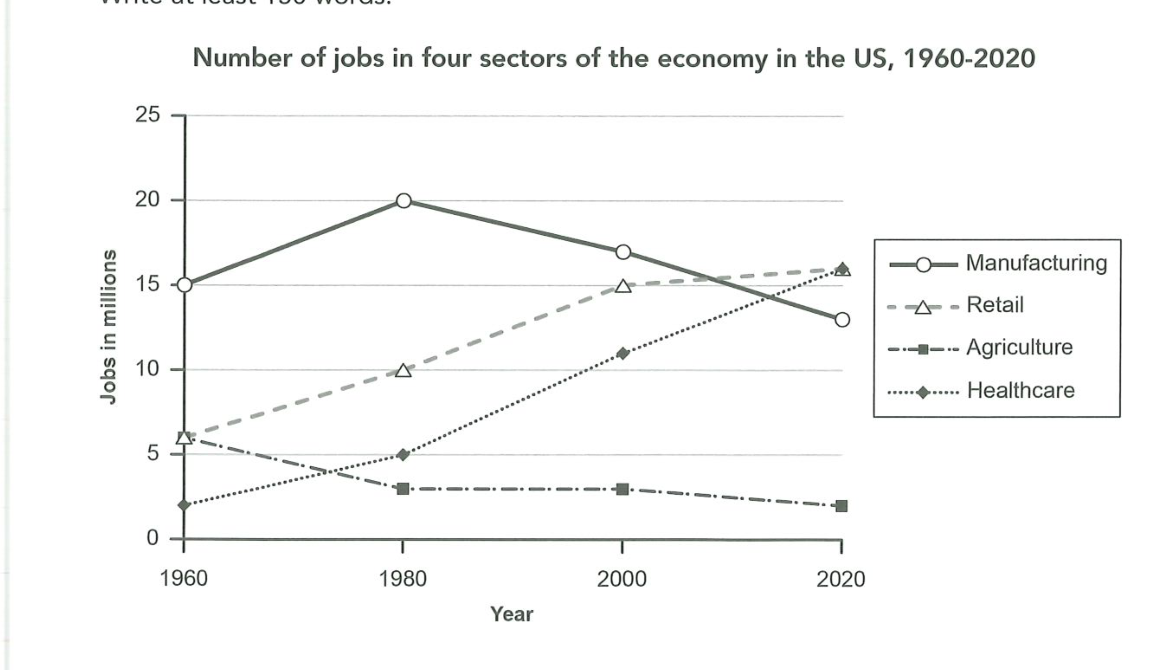
The graph below gives information about the number of jobs in four sectors of the economy in the US between 1960 and 2020.
Summarise the information by selecting and reporting the main features, and make comparisons where relevant.
Number of jobs in four sectors of the economy in the US, 1960-2020
Student answer (Band 4.5)
under given the graph show us the number of jobs in four section of the everage between the 1960 and 2020 year in the graph there are four different kinds of jobs first manufacturing second retail third agriculture and the last one is healthcare first the manufacturing the economey of manufacturing in year 1960 is 15 millon in the year 1980 the everage of this job is so high in 1980 the efficiency of this job is 20 millon in 2000 is on 17 millon and in the last year this is on 13 millon this show that his average coming low slow in retail job the economy in 1960 is 6 millon im 1980 it on 10 millon and this afficiency in 2000 is 15 millon an last year in 2020 is on 16 millon in agriculture jobs in 1960 the economy is on 6 millon in 1980 on 3 millon in 2000 it on remain 3 millon and in 2020 its efficiency on 2 millon the healthcare job in 1960 is on 2 millon in 1980 it on 5 millon in 2000 it on 11 millon and in 2020 the economy of this job on 16 millon
AI examiner evaluation
| Criterion | Band |
|---|---|
| Task Achievement / Task Response | 4.5 |
| Coherence and Cohesion | 4.5 |
| Lexical Resource | 4.5 |
| Grammatical Range and Accuracy | 4.5 |
| Overall | 4.5 |
Task Achievement / Task Response: Band 4.5
You report figures for all four sectors, and the values and main directions are generally consistent with the graph: manufacturing peaks at 20 million before falling, while retail and healthcare rise and agriculture declines. This gives the reader relevant information about the data. However, the response mainly lists figures sector by sector and does not provide a clear overview of the most important comparisons—for example, that manufacturing was highest initially, whereas retail and healthcare reached about 16 million by 2020. Some descriptions, such as “the efficiency of this job,” do not accurately explain what the figures represent. To strengthen the report, begin with a concise overview and select key comparisons rather than relying almost entirely on a sequence of numbers.
Coherence and Cohesion: Band 4.5
The response follows a recognisable order, moving through manufacturing, retail, agriculture and healthcare, so the reader can identify which sector each set of figures concerns. However, it is presented as one long, largely unpunctuated sequence, with no paragraphing or clear separation between the introduction and the data description. Repeated transitions such as “in 1960,” “in 1980” and “in 2000” make the progression mechanical, while phrases like “first the manufacturing” do not create a clear overview or comparison between sectors. Grouping the information into an introduction, an overview and one or two detail paragraphs would make the organisation easier to follow. Use linking language to show contrasts and shared trends, not only to introduce each year.
Lexical Resource: Band 4.5
You use a basic set of relevant terms, including the sector names and “million,” which allows the reader to recognise the subject and most figures. However, vocabulary is repetitive and several choices are inaccurate or unclear. “Efficiency” is used repeatedly where the graph shows the number of jobs, and “average” and “economy” do not describe the data precisely. There are also spelling errors such as “millon,” “economey” and “afficiency,” alongside awkward phrases such as “coming low slow.” These errors sometimes strain understanding. Build a more accurate range for describing trends and quantities, using terms such as “employment,” “rose,” “declined,” “remained stable” and “reached,” and check spelling carefully.
Grammatical Range and Accuracy: Band 4.5
The response communicates many figures through simple clauses, but grammatical control is weak and errors occur throughout. Sentence boundaries are often missing, as in the long opening sequence, which makes relationships between ideas difficult to follow. Verb forms and sentence patterns are frequently incomplete or inaccurate: “the graph show,” “in 1980 it on 10 million,” and “in 2000 it on remain 3 million” need clearer subjects and correctly formed verbs. Articles, prepositions and agreement are also inconsistent. The writing relies on repeated basic patterns rather than showing a controlled range of structures. Practise complete sentences such as “Retail employment rose from 6 million in 1960 to 10 million in 1980,” and use full stops to separate each comparison.
See this exact question answered at other band scores. The same prompt compared across bands.
Browse more IELTS Writing model answers or get your own writing scored by the same AI examiner.