Band 5.5 IELTS Writing Task 1 Model Answer
Overall Band Score: 5.5 · Cambridge IELTS 21 · 2026-11-21
IELTS Writing Task 1 question
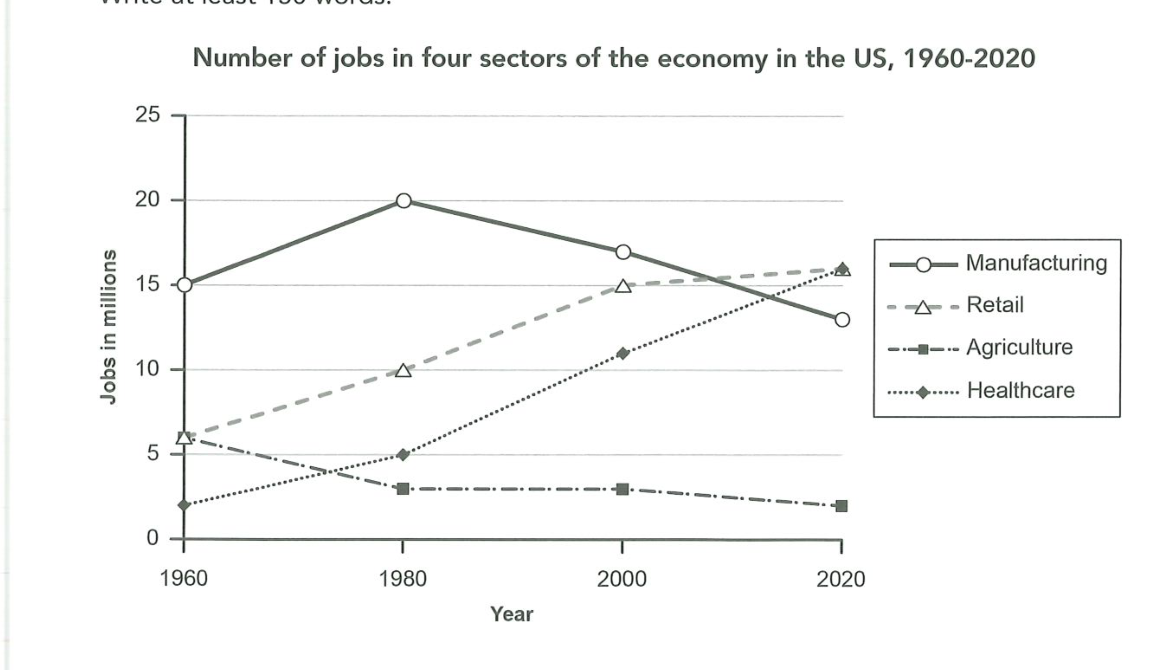
The graph below gives information about the number of jobs in four sectors of the economy in the US between 1960 and 2020.
Summarise the information by selecting and reporting the main features, and make comparisons where relevant.
Number of jobs in four sectors of the economy in the US, 1960-2020
Student answer (Band 5.5)
The diagram illustrate number of vacancy in diffrent feilds like manufacturing ,retail,agriculture and healthcare.
The job on manufacturing was significantly increase in 1980 .from 15%to 20%it got increased but in 2000 it drop to 16%and again if fall to 13%.in 1980 the number of job avilable reach to 10%in retail.while in 2000 it increases by 5% .in 2020 small increament was noticed by 2-3%.in agriculture it was not providing job in more number as it was providing employ by only 6%in 1960 which fall to 4%in 1980 and stayed the same to till 2000 .in 2020 it become a sector which is less involve to support the economy of us.In 1960 healthcare contribute only 4% to the economy of us by providing jobs .in 1980 it reach to 5% and with the time it goes upward and get involve to provide 11%job in 2000 and in 2020 it become one of the main sector to provide job in US by 16%
overall at first manufacturing was providing job in large scale but with the time retail and healthcare sactor become a sactor of the economy in US,[redacted phone]
AI examiner evaluation
| Criterion | Band |
|---|---|
| Task Achievement / Task Response | 5.5 |
| Coherence and Cohesion | 5.5 |
| Lexical Resource | 5.0 |
| Grammatical Range and Accuracy | 5.0 |
| Overall | 5.5 |
Task Achievement / Task Response: Band 5.5
You identify all four sectors and report several broad trends, especially manufacturing’s rise to a peak followed by decline and the growth of retail and healthcare. The closing comparison also recognises that manufacturing led initially while retail and healthcare became more prominent. However, some figures are inaccurate: manufacturing is given as 16 million in 2000 rather than about 17, agriculture as 4 million in 1980 rather than 3, and healthcare as 4 million in 1960 rather than 2. The retail changes are also described vaguely, and the overview does not clearly state that retail and healthcare both reached about 16 million by 2020. More accurate figures and a sharper summary of the main comparisons would make the report more complete.
Coherence and Cohesion: Band 5.5
The response follows a broadly understandable sequence, moving through the sectors and ending with an overall comparison. This gives the reader some sense of the chart’s development. However, most information is packed into one long paragraph, and the progression between sectors is not consistently signposted. Phrases such as “while in 2000” and “with the time” do not always make the relationship between figures clear, while the final overview arrives after the detailed account rather than being clearly separated. Organise the response into an introduction, a concise overview, and grouped detail paragraphs—for example, manufacturing and agriculture together, then retail and healthcare. This would make comparisons easier to follow and reduce the impression of a list.
Lexical Resource: Band 5.0
You use some relevant chart vocabulary, including “increased,” “fall,” “stayed the same,” and “provide jobs,” so the main trends can generally be understood. However, the range is limited and several word choices or collocations are inaccurate, such as “number of vacancy,” “employ by only,” and “less involve to support the economy.” Repetition of “job” and “sector” also makes the description less precise. There are noticeable spelling errors, including “diffrent,” “feilds,” “avilable,” and “sactor,” which reduce clarity and control. Aim for accurate, conventional language for describing data, and check spelling carefully; precise terms such as “employment,” “rose,” “declined,” and “accounted for” would help.
Grammatical Range and Accuracy: Band 5.0
The response attempts to describe changes over time and includes some longer sentence patterns, but control is inconsistent. Errors in verb forms and agreement appear in phrases such as “The diagram illustrate,” “it got increased,” and “it become one of the main sector.” Sentence boundaries and punctuation are also weak: several statements run together, as in “from 15%to 20%it got increased but in 2000 it drop.” Articles, plurals, and prepositions are often missing or inaccurate, which sometimes makes the relationships between figures difficult to interpret. Use shorter, complete sentences as a foundation, then add a few controlled complex sentences. Check subject–verb agreement, past-tense forms, and punctuation when describing the historical data.
See this exact question answered at other band scores. The same prompt compared across bands.
Browse more IELTS Writing model answers or get your own writing scored by the same AI examiner.