Band 5.0 IELTS Writing Task 1 Model Answer
Overall Band Score: 5.0 · Cambridge IELTS 21 · 2026-11-22
IELTS Writing Task 1 question
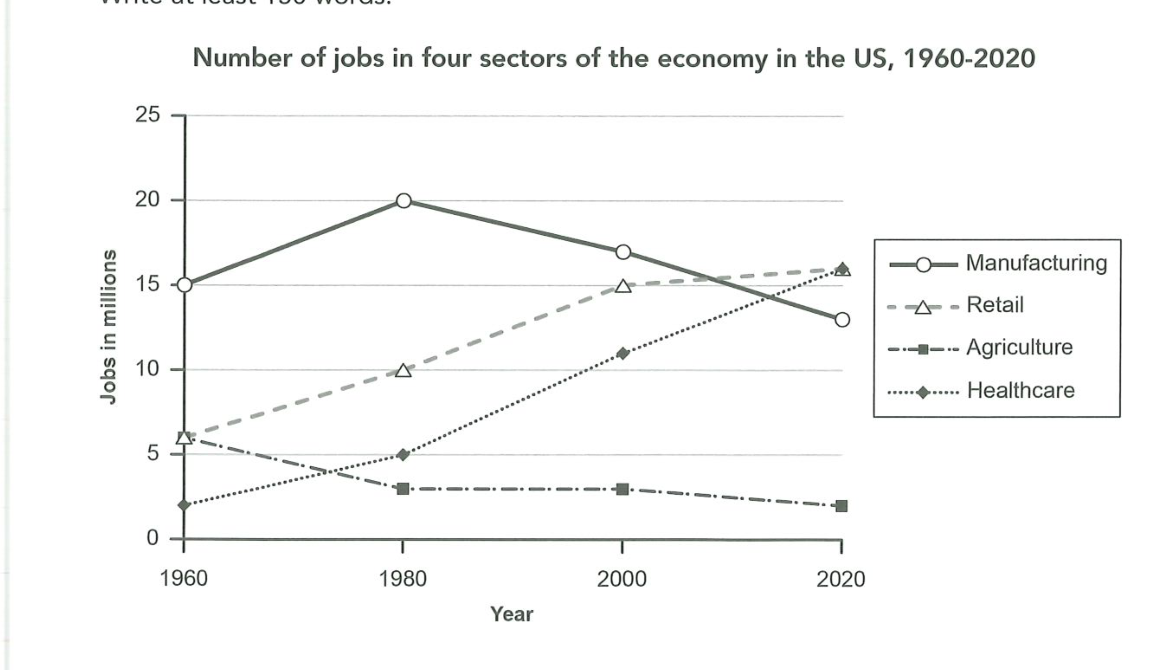
The graph below gives information about the number of jobs in four sectors of the economy in the US between 1960 and 2020.
Summarise the information by selecting and reporting the main features, and make comparisons where relevant.
Number of jobs in four sectors of the economy in the US, 1960-2020
Student answer (Band 5.0)
The graph illustrates the information about the number of jobs in four sectors of the economy in the US between 1960 and 2020. Firstly, in this graph, you can see the number of vaccancies from year 1960 to 1980, then 1980 to 2000 and then 2000 to 2020.While in vertical side of a graph there is a perameter in which millions of jobs were there from 0 to 25 scale. In this graph you can see the healthcare jobs were climbing up from 2 to approximately 17, then jobs of agriculture will comes and there is a certain decline in that jobs between this passage of time that is from 7 millions to 3 millions. After that the reatil jobs were there and we saw some positive change in this that they moved from 7 millions to 17 millions and stands with jobs of healthcare. Lastly, you can see the jobs of manufacturing in which there is a decline also, that from 15 millions to 13 millions, which is very surprising for me.
AI examiner evaluation
| Criterion | Band |
|---|---|
| Task Achievement / Task Response | 5.0 |
| Coherence and Cohesion | 4.5 |
| Lexical Resource | 5.0 |
| Grammatical Range and Accuracy | 5.0 |
| Overall | 5.0 |
Task Achievement / Task Response: Band 5.0
You identify all four sectors and describe several broad trends, including healthcare’s rise and agriculture’s decline. However, the account only partially reports the graph’s main features: it gives no clear overview of the overall changes or the sectors’ relative positions at key points. Some figures are inaccurate: healthcare ends at about 16 million, not 17; agriculture starts at 6 million, not 7; and retail rises from 6 to 16 million, rather than from 7 to 17. Manufacturing first increases from 15 to 20 million before falling to 13, but this important peak is omitted. Focus on accurate comparisons and summarise the main pattern rather than describing the graph’s axes or adding a personal reaction such as “very surprising for me.”
Coherence and Cohesion: Band 4.5
The response follows a basic sequence, moving through healthcare, agriculture, retail and manufacturing, and words such as “Firstly,” “After that” and “Lastly” signal the order. However, the organisation does not create a clear overview followed by logically grouped details. The opening body sentence mainly explains the time intervals and vertical scale, while the later sentences list sectors without showing how their trends compare. Some linking is awkward or mechanical, and the long gaps between sentences make the progression feel fragmented. Group related trends—for example, the rising healthcare and retail figures, then the declining agriculture and manufacturing figures—and use clear comparisons to connect them.
Lexical Resource: Band 5.0
You use some relevant vocabulary, including “decline,” “positive change” and “climbing up,” so the reader can generally identify the trends you intend to describe. However, the range is limited and several choices are inaccurate or unsuitable for a formal graph summary. “Vacancies” does not mean the number of jobs shown, and “parameter” is not the right term for the vertical scale. There are also noticeable spelling errors, including “vaccancies,” “perameter” and “reatil,” which reduce precision. Aim for standard chart language and accurate sector names, and avoid conversational wording such as “you can see” and the personal comment about being surprised.
Grammatical Range and Accuracy: Band 5.0
You attempt some longer sentences and use past-tense forms to describe changes, but the range is limited and errors occur frequently. For example, “agriculture will comes” combines an inappropriate future form with an incorrect verb form; “the number of vacancies from year 1960 to 1980” is an incomplete sentence; and “they moved from 7 millions to 17 millions and stands” shifts tense and has faulty agreement. Articles and sentence boundaries also need attention, as in “in vertical side of a graph.” Practise writing complete, controlled sentences with consistent past tense, such as “Healthcare employment rose from about 2 million to 16 million.” Check agreement, plurals and punctuation before finishing.
See this exact question answered at other band scores. The same prompt compared across bands.
Browse more IELTS Writing model answers or get your own writing scored by the same AI examiner.