Band 5.5 IELTS Writing Task 1 Model Answer
Overall Band Score: 5.5 · Cambridge IELTS 21 · 2026-11-22
IELTS Writing Task 1 question
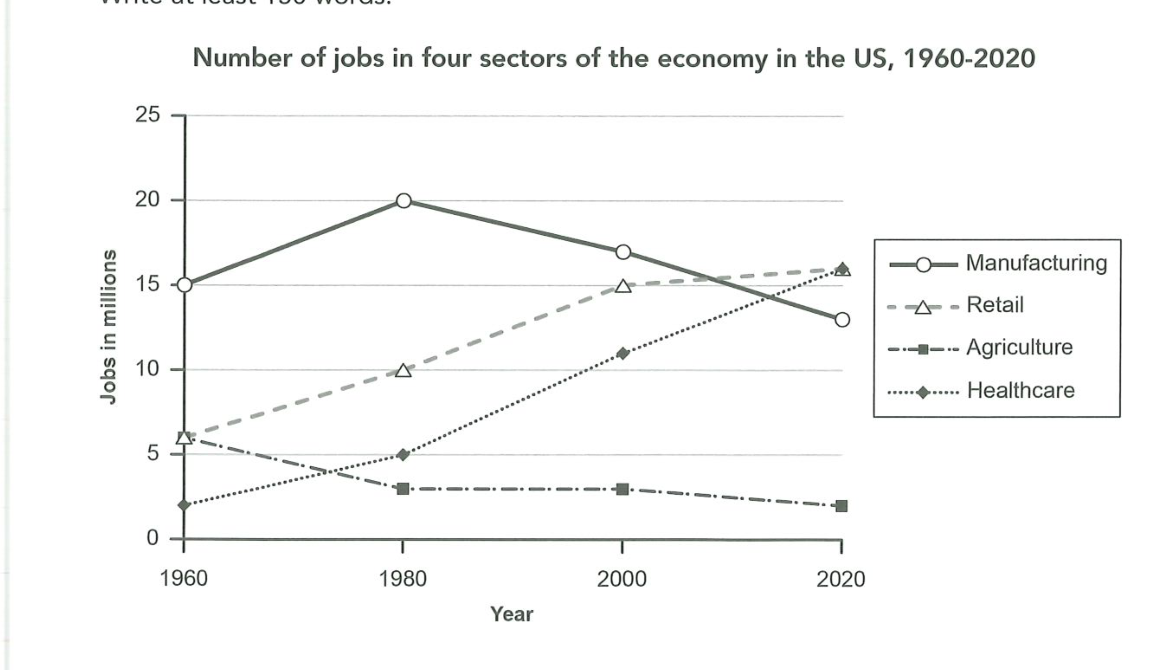
The graph below gives information about the number of jobs in four sectors of the economy in the US between 1960 and 2020.
Summarise the information by selecting and reporting the main features, and make comparisons where relevant.
Number of jobs in four sectors of the economy in the US, 1960-2020
Student answer (Band 5.5)
the graph we have illustrate data in a periode of time between 1960 and 2020 of 4 diffrent job title that located in the US.
Overall the biggess change of the for sectors will be the rasing of healthcare and retail , in the other hand the drop of agriculture.
in the early of 1960 the graph shows the manufacturing jobs taking the lead with 15 % and the lowest taken healthcare by 2% , and both retail and agriculture starting from 6%. moving to year 1980, manufacturing hited it highest pick with 20% , moving to the slow rize for both healthcare and retail reaching 5% and 10%.but agriculture droping to 3%
after 20 years from that,the year 2000 , where we watch the first drop of manufacture jobs number ,moving down to 17% , and the stable rising again for retail and healthcare moving up to 15 and 11 percent , and for the agriculture its still in 3% like 20 years befor. and final in year 2020 , our two rising job sector ,the retail and healthcare reach the highest point agains the other sector with 16% , and the for manufacturing it droped again to 13%, and finaly agriculture also droped by 1% to reach a total of 2%.
AI examiner evaluation
| Criterion | Band |
|---|---|
| Task Achievement / Task Response | 6.0 |
| Coherence and Cohesion | 6.0 |
| Lexical Resource | 5.0 |
| Grammatical Range and Accuracy | 5.0 |
| Overall | 5.5 |
Task Achievement / Task Response: Band 6.0
You cover the main movements across all four sectors and include relevant figures: manufacturing peaks at 20 in 1980 before falling to 13, while agriculture declines to 2 by 2020. Your overview correctly highlights the rise in healthcare and retail and the fall in agriculture. However, some comparisons are less fully expressed: for example, healthcare and retail both finish at 16, tying as the highest sectors, but this could be stated more clearly as a key final comparison. Also, the chart reports jobs in millions, not percentages, so describing values as “15%” or “2%” misrepresents the units. Keep the overview concise and ensure every figure uses the correct unit.
Coherence and Cohesion: Band 6.0
The response has a clear overall arrangement: an introduction, an overview, and a chronological account of the four years. This makes the main trends reasonably easy to follow. Time markers such as “in the early of 1960,” “moving to year 1980,” and “final in year 2020” help signal progression, although some are awkward or repetitive. Several long sentences join multiple trends with commas and “and,” making comparisons harder to track; the 2000 and 2020 sections would be clearer if each grouped the rising sectors separately from the declining ones. Use more controlled sentence boundaries and a few precise links, rather than relying repeatedly on “moving” and “and.”
Lexical Resource: Band 5.0
You use enough topic vocabulary to describe trends, including “drop,” “rising,” “highest point,” and “reach,” and the reader can generally identify the intended changes. However, spelling and word-choice errors are noticeable, as in “biggess,” “rasing,” “hited,” “pick,” and “befor.” Some expressions are also imprecise or unnatural: “job title” does not describe economic sectors, and “slow rize” is not a suitable collocation for a gradual increase. Repeated use of “moving” and “drop” limits variety. Build a more accurate set of trend terms and check spelling; use “sector,” “rose gradually,” “peaked,” and “declined” where appropriate.
Grammatical Range and Accuracy: Band 5.0
You attempt both simple and more extended sentences, and the chronological structure allows you to communicate the broad trends. However, some sentence forms are faulty or incomplete, for example, “the graph we have illustrate data” and “and the lowest taken healthcare by 2%.” Verb forms and agreement also need attention: “manufacturing jobs taking the lead” and “agriculture droping” do not fit their sentence structures. Punctuation is inconsistent, with missing spaces after full stops and several comma-linked clauses. Practise forming a complete subject–verb sentence for each comparison, and use past-tense verbs consistently when reporting the historical data. These changes would make your meaning more reliable.
See this exact question answered at other band scores. The same prompt compared across bands.
Browse more IELTS Writing model answers or get your own writing scored by the same AI examiner.