Band 5.5 IELTS Writing Task 1 Model Answer
Overall Band Score: 5.5 · Cambridge IELTS 21 · 2026-11-22
IELTS Writing Task 1 question
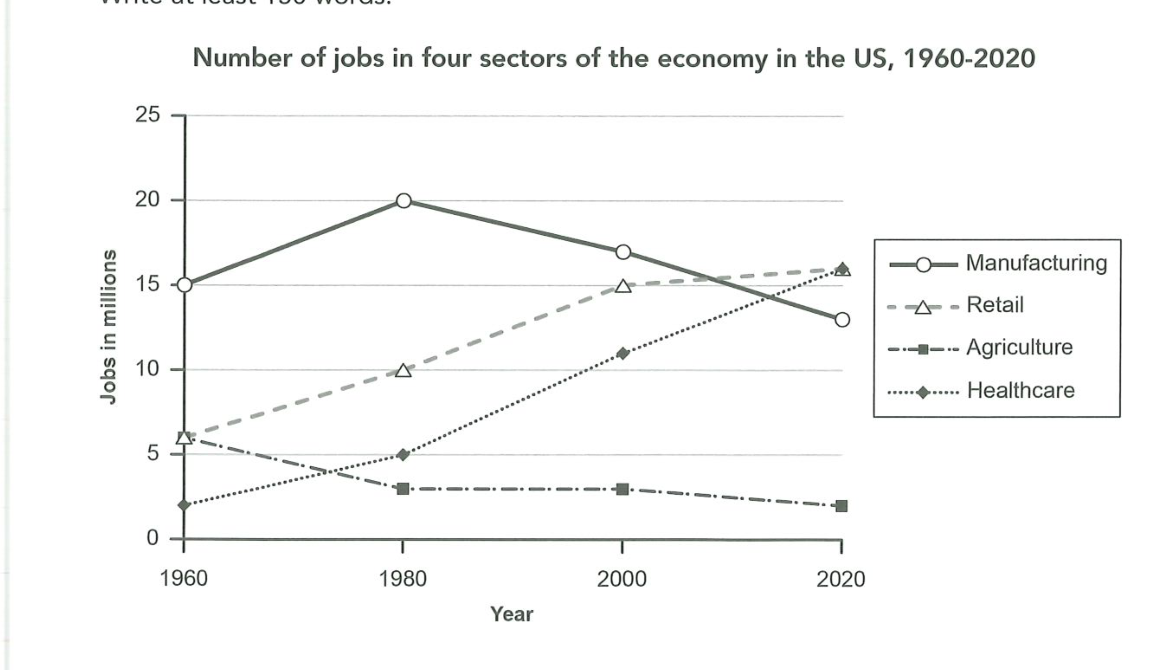
The graph below gives information about the number of jobs in four sectors of the economy in the US between 1960 and 2020.
Summarise the information by selecting and reporting the main features, and make comparisons where relevant.
Number of jobs in four sectors of the economy in the US, 1960-2020
Student answer (Band 5.5)
The provided graph gives us information about number of jobs in different sectors of economy in the US between year 1960 and 2020.
In 1960, jobs in manufacturing sector were 15 millions as compare to it, jobs in retail and agriculture were almost 7 millions whereas jobs in the sector of healthcare were only 2 or 3 million. This shows that in 1960 manufacturing sector provided more employment as compare to other 3 sectors.In year 1980, manufacturing sector provided 20 million of jobs whereas, in retailing sector 10 million of jobs were provided. There was a sudden decline in agricultural sector from almost 7 million to 4 million.There was rise in jobs of healthcare, as number of jobs increased from almost 3 millions to 5 millions. In year 2000, manufacturing industry still provided more jobs than any of other sector around 16 millions. Manufacturing sector provided 15 millions of jobs followed by agriculture sector around 11 millions. Whereas there a sudden increase in the number of jobs in healthcare around 11 million. In 2020, there was decline in manufacturing sector's jobs 13 million. In retailing and healthcare, it was 16 million and in agriculture it was 3 millions.
AI examiner evaluation
| Criterion | Band |
|---|---|
| Task Achievement / Task Response | 4.5 |
| Coherence and Cohesion | 5.5 |
| Lexical Resource | 5.5 |
| Grammatical Range and Accuracy | 5.5 |
| Overall | 5.5 |
Task Achievement / Task Response: Band 4.5
The response identifies several relevant figures and changes, including manufacturing’s peak of 20 million in 1980 and the rise in healthcare employment to about 11 million by 2000. However, it does not provide a clear overview of the main trends, and some comparisons are inaccurate or confusing. For example, in 2000 manufacturing was about 17 million, not 15 million, while retail was about 15 million; the response instead says agriculture was around 11 million, which is actually the healthcare figure. It also gives agriculture as 3 million in 2020, rather than about 2 million. To make the report more complete and accurate, summarise the broad pattern first and check each sector’s figures and rankings against the graph.
Coherence and Cohesion: Band 5.5
The response follows a generally understandable chronological order, moving from 1960 through 2020, and uses time markers such as “In year 1980” and “In 2020” to guide the reader. However, it is presented as one continuous paragraph, so the overview and detailed comparisons are not clearly separated. Several transitions are awkward or repetitive, particularly the repeated use of “whereas” and “In year,” and some links make relationships unclear. For instance, the 2000 sentence shifts between manufacturing, agriculture and healthcare without clearly distinguishing their figures. Use a short introduction and overview, followed by logically grouped details, and make each comparison explicit to improve progression and cohesion.
Lexical Resource: Band 5.5
The response uses relevant vocabulary for describing employment data, including “decline,” “rise,” “increased,” and “provided more jobs.” These choices make the general subject clear, but the range is limited and some expressions are repetitive or imprecise. “Jobs in different sectors of economy” and “jobs were provided” are less natural than “employment across four sectors” and “the sector employed.” The repeated phrase “manufacturing sector” also reduces variety, while “sudden decline” is not especially precise for a change shown across a 20-year interval. Aim for accurate, varied terms such as “rose steadily,” “fell,” “reached a peak,” and “accounted for,” while ensuring that the chosen wording matches the trend shown.
Grammatical Range and Accuracy: Band 5.5
There is an attempt to combine clauses and compare figures, and the chronological sentences are mostly understandable. However, grammatical errors occur throughout and sometimes make relationships between figures difficult to follow. Examples include “between year 1960 and 2020,” “as compare to it,” and “There was rise in jobs”; these need more accurate articles, forms and sentence patterns. The sentence “In year 2000, manufacturing industry still provided more jobs than any of other sector around 16 millions” is also structurally unclear, and the following figures are difficult to connect to the correct sectors. Practise accurate comparative structures and check articles, singular/plural forms, and punctuation. Shorter, well-controlled sentences would help communicate the data more clearly.
See this exact question answered at other band scores. The same prompt compared across bands.
Browse more IELTS Writing model answers or get your own writing scored by the same AI examiner.