Band 5.5 IELTS Writing Task 1 Model Answer
Overall Band Score: 5.5 · Cambridge IELTS 21 · 2026-11-06
IELTS Writing Task 1 question
The chart and table below show the results of a survey of library users at a university.
Summarise the information by selecting and reporting the main features, and make comparisons where relevant.
Categories of library users
Student answer (Band 5.5)
The chart and table illustrate the results of a survey of library user at a universty.
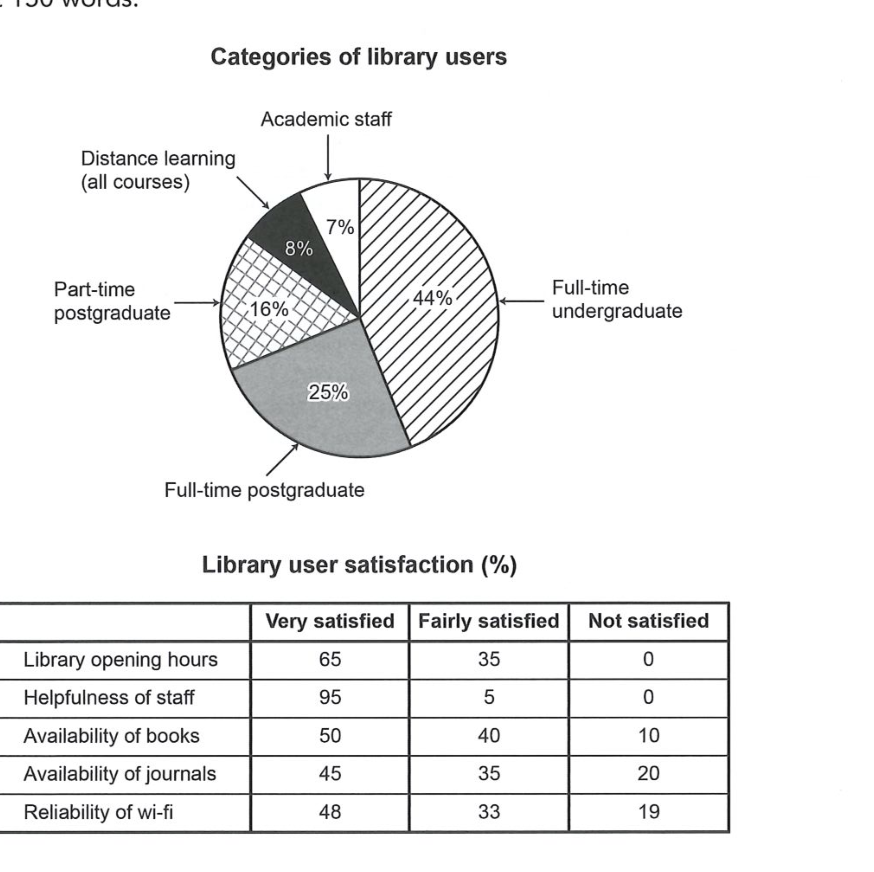
First of all, the categories of library users Academic staff 7%, Distance learning(al courses) 8%, Part-time postgraduate 16%, Full-time postgraduate 25%, and the Full-time ungraduate show the 44%.
Secondly, the library user satisfaction percentage the three types of satisfaction first ver satisfied, Fairly satisfied, Not satisfied. Show the library opening hours show the percentage of different satisfaction Very satisfied 65%, Fairly satisfied 35%, and the last Not satisfied 0%. And the helpfulness of staff show the very satisfied 95%, Fairly satisfied 5% and the Not satisfied 0%. Availability of books show the Very satisfied 50%, Fairly satisfied 40%, and the Not satisfied 10%. Availability of journals show the Very satisfied 45%, Fairly satisfied 35% and the Not satisfied show the 20%. And the last categorie the name of Reliability of wi-fi show the Very satisfied 48%, Fairly satisfied show the 33% and the last Not satisfied 19%.
Overall, the highest categorie the name of full-time undergraduate 44%, and the lowest categorie the name of Academic staff 7%. And the Satisfaction the highest percentage the name of Helpfulness of staff Very satisfied 95%, and fairly satisfied Availability of books 40%, and the not satisfied Availability of journals the 20%.
AI examiner evaluation
| Criterion | Band |
|---|---|
| Task Achievement / Task Response | 6.0 |
| Coherence and Cohesion | 6.0 |
| Lexical Resource | 5.0 |
| Grammatical Range and Accuracy | 5.0 |
| Overall | 5.5 |
Task Achievement / Task Response: Band 6.0
You report the main figures from both visuals accurately, including the user-category proportions and all five satisfaction rows. The overview also identifies the largest and smallest user groups and the highest very-satisfied result, which gives the reader useful headline information. However, the overview is less complete than the detailed reporting: it does not clearly summarise the broader pattern that staff helpfulness and opening hours received especially positive ratings, while journals and Wi-Fi attracted more dissatisfaction. The final comparison of “fairly satisfied” ratings is also selective, mentioning books but not placing it against the other categories. To strengthen the response, prioritise two or three overall patterns and compare the satisfaction categories more explicitly rather than mainly listing each set of figures.
Coherence and Cohesion: Band 6.0
The response has a recognisable structure: it introduces the visuals, reports user categories, moves to satisfaction results, and ends with an overview. This makes the information generally easy to follow. However, the repeated sequencing words “First of all,” “Secondly,” and repeated “And” create a mechanical, list-like progression. Several sentences also run together multiple data points, particularly the long section beginning “Availability of books show…”, so the relationships between comparisons are not always clear. The overview appears at the end rather than guiding the reader before the details, and its points partly repeat earlier figures. Use distinct paragraphs for the two visuals and a concise overview near the beginning; then group related satisfaction results to create clearer comparisons.
Lexical Resource: Band 5.0
Your vocabulary is sufficient to identify the chart categories and satisfaction levels, and terms such as “Academic staff,” “Availability of journals,” and “Reliability of wi-fi” are used in ways that convey the data. However, the range of reporting language is limited, with repeated use of “show,” “percentage,” “categorie,” and “the name of.” Some word choices and spelling errors are noticeable, including “universty,” “ungraduate,” and “ver satisfied,” and “the last categorie” is an imprecise way to introduce the final row. These issues do not prevent the reader from understanding the figures, but they make the report less natural and precise. Practise varied chart language such as “accounted for,” “recorded,” and “rated,” while checking spelling and using concise labels.
Grammatical Range and Accuracy: Band 5.0
You attempt to report several figures in connected sentences, and the meaning is usually recoverable. However, sentence structures are often incomplete or awkward, as in “the categories of library users Academic staff 7%…” and “the library user satisfaction percentage the three types of satisfaction…” These lack clear grammatical links between the subject, verb, and information. Agreement is also inconsistent in phrases such as “the highest categorie … 44%,” while repeated sentence fragments beginning “And the last…” weaken control. Most reporting relies on simple patterns, with little accurate variation in complex structures. Build complete sentences with a clear subject and verb—for example, “Full-time undergraduates made up the largest group, at 44%”—and use parallel structures when comparing satisfaction ratings.
See this exact question answered at other band scores. The same prompt compared across bands.
Browse more IELTS Writing model answers or get your own writing scored by the same AI examiner.