Band 7.0 IELTS Writing Task 1 Model Answer
Overall Band Score: 7.0 · Cambridge IELTS 21 · 2026-11-06
IELTS Writing Task 1 question
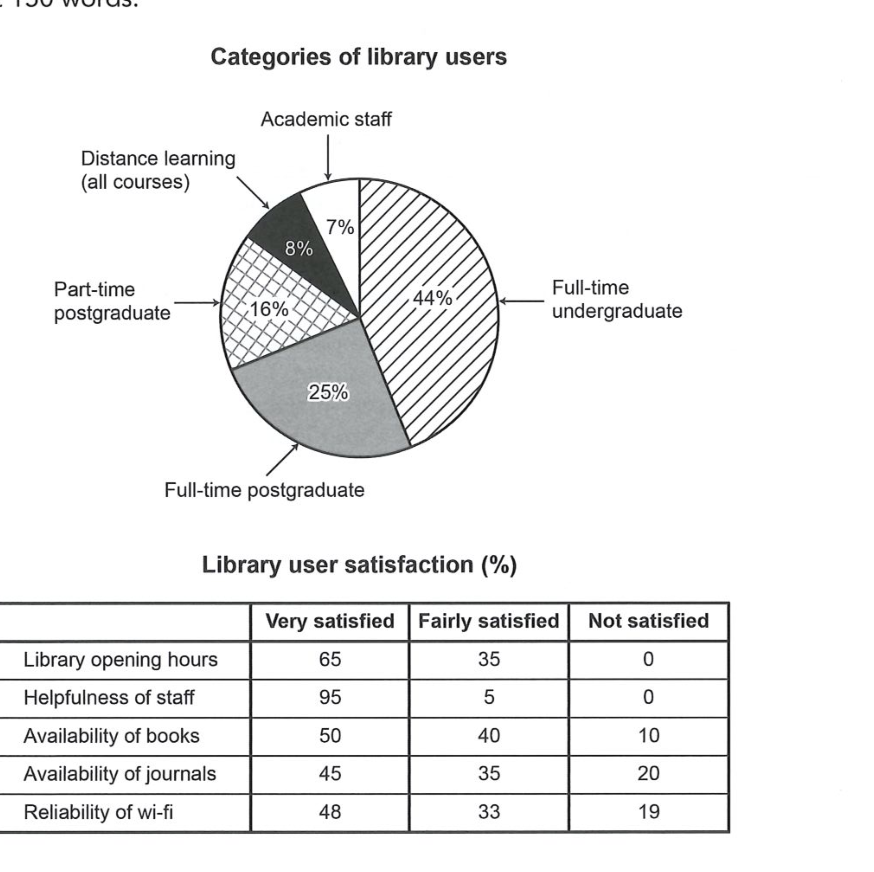
The chart and table below show the results of a survey of library users at a university.
Summarise the information by selecting and reporting the main features, and make comparisons where relevant.
Categories of library users
Student answer (Band 7.0)
The pie chart illustrates the five categories of library users in an university and the table shows the satisfaction of library users divided in three different level for five categories in percentage.
Overall, the full-time undergraduate students constituted the largest proportion of library user, whereas the academic staff and online students least visited the library. The library users were most satisfied with the helpfulness of the staffs, while they were least satisfied with the availability of journals.
The full-time undergraduate were 44% of the total of library users, while full-time postgraduates were the second most at 25%. The academic staff and distance learning students were the least, 7% and 8% respectively. Lastly, the part-time postgraduate students stood in between all at 16%.
There was no dissatisfaction among the library users with the library opening hours and helpfulness of the staffs. Moreover, about 95% of them were very satisfied and 5% fairly satisfied with the helpfulness of staffs, while only 80% were satisfied altogether in the availability of journals with 20% being not satisfied. There were still dissatisfaction of about 10% and 19% among library users on the availability of books and reliability of wi-fi respectively.
AI examiner evaluation
| Criterion | Band |
|---|---|
| Task Achievement / Task Response | 7.0 |
| Coherence and Cohesion | 7.0 |
| Lexical Resource | 6.5 |
| Grammatical Range and Accuracy | 6.5 |
| Overall | 7.0 |
Task Achievement / Task Response: Band 7.0
The response addresses both visuals and gives a clear overview: undergraduates form the largest user group, while staff satisfaction is highest and journal satisfaction is weakest. The figures selected are generally accurate, including the 44%, 25%, 7% and 8% user shares and the 95%/5% staff ratings. You also identify the absence of dissatisfaction with opening hours and staff helpfulness. To make the account more fully developed, report the opening-hours split (65% very satisfied and 35% fairly satisfied) and clarify that the 80% satisfied with journals comprises 45% very satisfied and 35% fairly satisfied. The final sentence gives dissatisfaction figures for books and wi-fi but omits their positive ratings, so those comparisons remain less complete.
Coherence and Cohesion: Band 7.0
The response is organised effectively into an introduction, an overview, a paragraph on user categories and a paragraph on satisfaction. This creates a clear progression from the main patterns to supporting details. Linking expressions such as “Overall,” “while,” “Moreover” and “Lastly” help connect comparisons, and the reader can follow the information without difficulty. Some links are slightly mechanical, however, and the final paragraph moves quickly between satisfaction categories without a consistent pattern. For example, it gives the journal satisfaction total, then mentions dissatisfaction for books and wi-fi, but does not report the corresponding positive ratings. Grouping the satisfaction data by strongest and weakest results, or reporting each category in the same order, would make the progression more controlled.
Lexical Resource: Band 6.5
You use a suitable range of task-related vocabulary, including “constituted the largest proportion,” “stood in between” and “dissatisfaction,” and the meaning is consistently clear. There is some flexibility in describing proportions and comparing satisfaction levels. However, several choices are imprecise or unnatural for this context: “online students” does not match the chart’s “distance learning” category, “least visited” suggests frequency of visits rather than user share, and “satisfaction … divided in three different level” is awkward. “Staffs” is also not the usual plural form when referring to employees. These slips do not prevent understanding, but more precise collocations and consistent use of the chart’s labels would strengthen the vocabulary control.
Grammatical Range and Accuracy: Band 6.5
The response includes a useful mix of simple and complex structures, such as the contrast in “The full-time undergraduate were 44% … while full-time postgraduates were the second most at 25%.” Most relationships between ideas remain clear, and the overview is expressed in complete sentences. Some grammatical errors persist, particularly with articles, agreement and plural forms: “in an university” should be “at a university,” “The full-time undergraduate were” needs a plural noun phrase, and “There were still dissatisfaction” requires a singular construction such as “There was still dissatisfaction.” The phrase “divided in three different level” also has errors in preposition and number. Greater accuracy in these basic patterns, alongside the existing sentence variety, would improve control.
See this exact question answered at other band scores. The same prompt compared across bands.
Browse more IELTS Writing model answers or get your own writing scored by the same AI examiner.