Band 6.5 IELTS Writing Task 1 Model Answer
Overall Band Score: 6.5 · Cambridge IELTS 21 · 2026-11-06
IELTS Writing Task 1 question
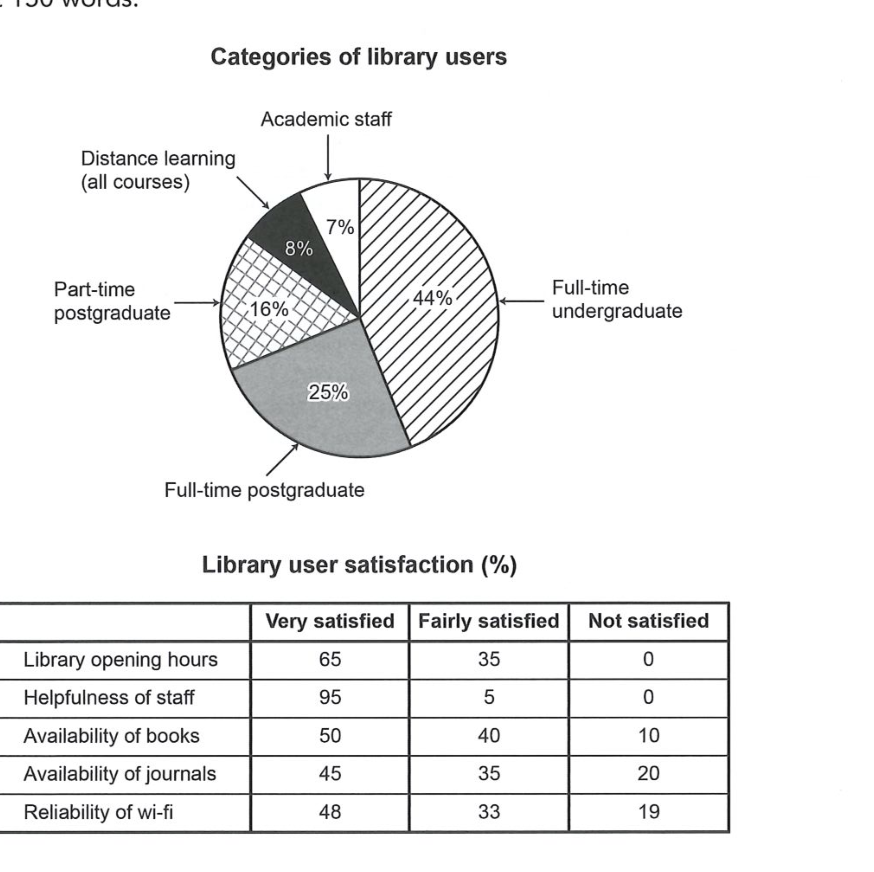
The chart and table below show the results of a survey of library users at a university.
Summarise the information by selecting and reporting the main features, and make comparisons where relevant.
Categories of library users
Student answer (Band 6.5)
The given chart and table illustrate the outcomes of a survey, conducted at a university. The information is about library users and their level of satisfaction, provided in percentage.
In the chart, it's clearly evident that the library is used by full-time undergraduates with a leading number of 44% out of five categories. Then comes the second category of full time post-graduates in the chart, with 25%, followed by the third type i.e., part-time postgraduates with 16%. The percentages of academic staff and distance learning users was found close to each other, having 7% and 8% simultaneously.
The table provides figures indicating the level of satisfaction by different users in different respects. The category in the table that has the highest percentage of user satisfaction is the helpfulness of staff with 95%. Secondly, the category of library opening hours is marked satisfied by 65% of users. 50% of users found availability of books satisfactory. Followed by two more categories with 48% and 45% in the very satisfied column.
AI examiner evaluation
| Criterion | Band |
|---|---|
| Task Achievement / Task Response | 5.5 |
| Coherence and Cohesion | 6.5 |
| Lexical Resource | 6.5 |
| Grammatical Range and Accuracy | 6.5 |
| Overall | 6.5 |
Task Achievement / Task Response: Band 5.5
You identify the main user group correctly: full-time undergraduates account for 44%, followed by full-time postgraduates at 25%, and you also report the smaller groups accurately. The satisfaction section, however, is only partly covered. You highlight the highest figures in the “very satisfied” column, but do not report the fairly or not satisfied results, so important contrasts are missing—for example, no users were dissatisfied with opening hours or staff helpfulness, while 20% were dissatisfied with journal availability. The overview is also limited: a clear summary comparing the user profile with the overall satisfaction pattern would help. Some wording is imprecise, such as saying users found books “satisfactory” when the 50% figure refers specifically to “very satisfied.”
Coherence and Cohesion: Band 6.5
The response has a clear overall arrangement: an introduction is followed by a paragraph on user categories and one on satisfaction. This makes the two visuals easy to distinguish, and sequencing phrases such as “Then comes,” “followed by,” and “Secondly” help guide the reader. However, the progression within the table paragraph is incomplete: it lists selected “very satisfied” figures but does not explain the other satisfaction levels or draw the comparisons together. The phrase “Followed by two more categories” is also a sentence fragment, which interrupts the flow. To strengthen cohesion, group the satisfaction results by pattern—for example, contrast the strongest ratings for staff and opening hours with the more mixed views of books, journals, and wi-fi—and use clear references to the table categories.
Lexical Resource: Band 6.5
You use an adequate range of task-related vocabulary, including “categories,” “level of satisfaction,” “availability,” and “percentage,” and the meaning is generally clear. There are also attempts at more formal reporting language, such as “illustrate” and “indicating.” Some choices are imprecise or unnatural, though. “Leading number” would be better expressed as “largest proportion,” while “having 7% and 8% simultaneously” is not a natural way to report the figures. “Marked satisfied” and “found availability of books satisfactory” blur the distinction between the table’s “very satisfied” category and satisfaction in general. Aim for precise chart language and reuse the table’s rating labels accurately; this will make comparisons clearer and more natural.
Grammatical Range and Accuracy: Band 6.5
You use a mix of simple and more developed sentence forms, and most sentences communicate the intended information. For example, the opening sentence introduces both visuals, while the longer sentence beginning “The percentages of academic staff…” combines related figures. Some grammatical errors and awkward constructions remain. In “The percentages … was found,” the plural subject requires “were,” and “The category … is … with 95%” would be clearer as “The highest very-satisfied figure was for staff helpfulness, at 95%.” The final sentence beginning “Followed by two more categories” is a fragment and should be joined to the preceding sentence or rewritten as a complete clause. Check agreement and ensure each sentence has a clear subject and verb.
See this exact question answered at other band scores. The same prompt compared across bands.
Browse more IELTS Writing model answers or get your own writing scored by the same AI examiner.