Band 6.0 IELTS Writing Task 1 Model Answer
Overall Band Score: 6.0 · Cambridge IELTS 21 · 2026-11-07
IELTS Writing Task 1 question
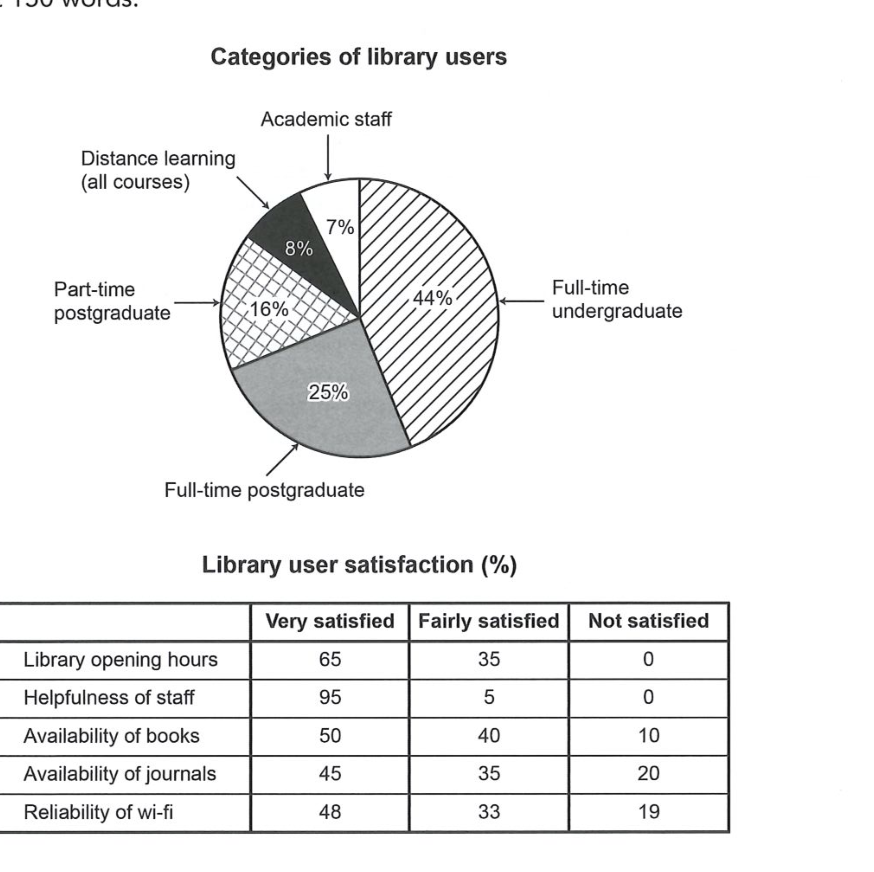
The chart and table below show the results of a survey of library users at a university.
Summarise the information by selecting and reporting the main features, and make comparisons where relevant.
Categories of library users
Student answer (Band 6.0)
The pie chart illustrate the proportion of different categories of library users, while the table demonstrate the proportion of libarary user satisfaction.
Overall, it is evident that full time undergraduate represent the highest percentage of library users. The satisfaction for helpfulness of staff provide the most significant proportion.
In the pie chart, 44% of full time undergraduate were library users which showed the most popular among all categories, while academic staff was the least popular catergories for 7%, followed by distance learning of 8% which makes it second lowest categories. Meanwhile, part-time postgraduate and full time postgraduate recorded of 25% and 16% respectively.
On the other hand, library user satisfied highest with the helpfulness of staff for 95% they were very satisfied, whereas availability of journals was the most unsatisfied group among 20% users. No users reported unsatisfied for libraray opening hours.
AI examiner evaluation
| Criterion | Band |
|---|---|
| Task Achievement / Task Response | 6.0 |
| Coherence and Cohesion | 6.5 |
| Lexical Resource | 5.5 |
| Grammatical Range and Accuracy | 5.5 |
| Overall | 6.0 |
Task Achievement / Task Response: Band 6.0
You identify the main user group correctly: full-time undergraduates account for 44%, while academic staff are the smallest group at 7%. You also report the strongest satisfaction result accurately (95% very satisfied with staff helpfulness) and note that nobody was dissatisfied with opening hours. However, the overview is incomplete: it does not summarise the broader satisfaction pattern, such as the generally high ratings and the comparatively greater dissatisfaction with journals and wi-fi. Some details are also unclear or inaccurate: you reverse the postgraduate figures, giving part-time postgraduate as 25% and full-time postgraduate as 16%, when the chart shows 16% and 25% respectively. The response is also below the required 150 words. Develop the overview and check all figures before reporting them.
Coherence and Cohesion: Band 6.5
The response has a clear overall arrangement: an introduction, an overview, and separate paragraphs for the chart and table. The contrastive linkers “while” and “On the other hand” help distinguish the two visuals, and the reader can follow the main points. This is a coherent structure, but progression within the details is sometimes less smooth. For example, the sequence “academic staff… followed by distance learning” is understandable, yet the later postgraduate comparison reverses the categories and makes the information harder to track. The table paragraph selects only a few results, so the comparison across satisfaction categories remains limited. To strengthen cohesion, group related figures consistently and use clear references such as “this was followed by…” while ensuring each comparison is accurate.
Lexical Resource: Band 5.5
You use relevant task vocabulary, including “proportion,” “categories,” “satisfaction,” and “unsatisfied,” and the meaning is generally clear. However, several word choices and collocations are inaccurate or awkward, such as “the most popular among all categories,” “the most unsatisfied group,” and “recorded of 25%.” “Popular” suggests preference rather than the share of users, while “group” does not clearly identify a satisfaction rating. Spelling errors such as “libarary,” “catergories,” and “libraray” also reduce accuracy. Aim for precise chart language, for example “accounted for,” “had the highest proportion,” and “the largest share reported dissatisfaction.” Check spelling carefully and avoid repeating broad terms when a more exact description is available.
Grammatical Range and Accuracy: Band 5.5
You attempt a mix of simple and complex sentence forms, including clauses linked with “while” and “whereas,” and the main message remains understandable. Some grammatical errors persist, particularly subject–verb agreement: “The pie chart illustrate” and “the table demonstrate” need singular verbs. There are also problems with number and sentence construction in “full time undergraduate represent” and “they were very satisfied,” where the reference is not fully clear. The phrase “recorded of 25% and 16%” shows an inaccurate grammatical pattern, and missing hyphens in compound modifiers such as “full-time” affect presentation. Work on agreement, articles, and complete, well-formed comparisons. More accurate control of these patterns would make the range you attempt clearer and more reliable.
See this exact question answered at other band scores. The same prompt compared across bands.
Browse more IELTS Writing model answers or get your own writing scored by the same AI examiner.