Band 6.5 IELTS Writing Task 1 Model Answer
Overall Band Score: 6.5 · Cambridge IELTS 21 · 2026-11-07
IELTS Writing Task 1 question
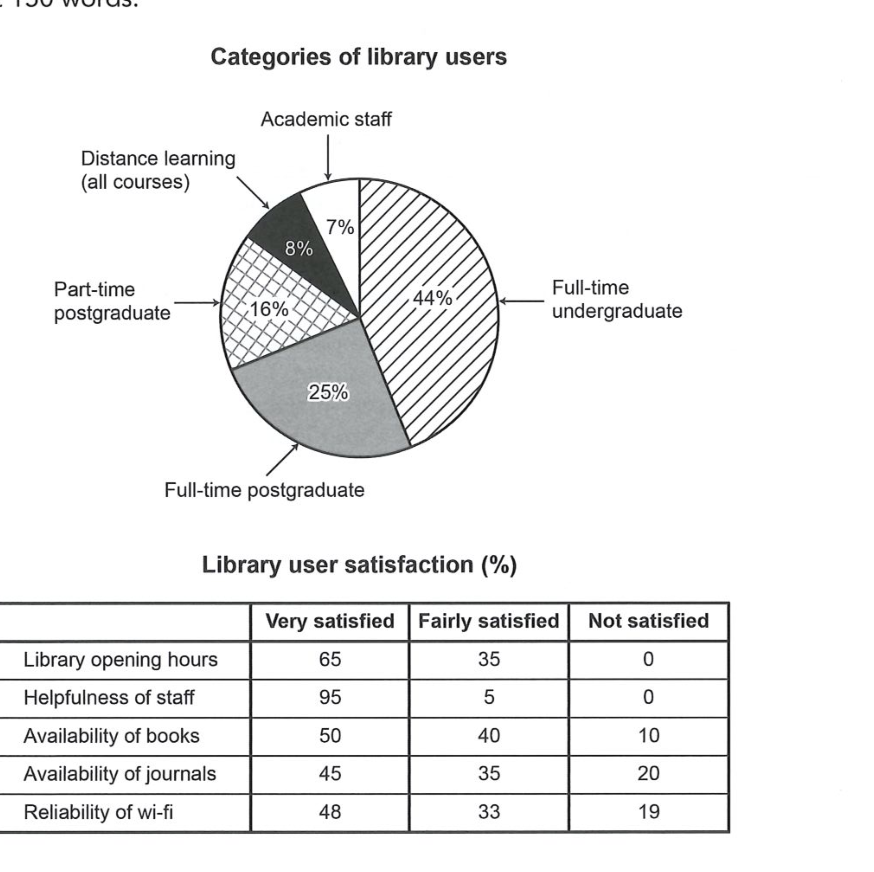
The chart and table below show the results of a survey of library users at a university.
Summarise the information by selecting and reporting the main features, and make comparisons where relevant.
Categories of library users
Student answer (Band 6.5)
The chart and table given illustrate the categories of library users and their satisfaction. The figures are given in percentages.
Overall, there are 5 types of people who use library. Some of them use it more than the others like the full time undergraduate students and not everyone is satisfied with all the facilities of the library.
Looking at the chart, the highest number of library users are the full time undergraduates making up 44% of the total users. Second on the chart are full time post graduates being a quarter of the total users followed by part time postgraduates who only add 16% in the library users. Shockingly, distance learning only amounts to 8% users in the library which is almost half the part time graduates. Lowest on the chart is the academic staff by being 7% of the total users.
However, the table depicts some satisfactory and dissatisfactory aspects of the library among the users. 95% of the users are very satisfied with the helpfulness of staff and 5% are fairly satisfied with it making it the highest satisfactory element in the table, no one is dissatisfied with the opening hours of the library. Dissatisfaction in the availability of books amounts to 10% of the users and the remaining 40% are fairly satisfied and 50% are very satisfied with it. Most non satisfactory aspect by the users is viewed to be the availability of journals amounting to 20% of the users, the remaining 80% are satisfied with it. Reliability of wi-fi is unsatisfactory by 19% of the users. The remaining 81% are satisfied with it, some more than the others.
AI examiner evaluation
| Criterion | Band |
|---|---|
| Task Achievement / Task Response | 6.5 |
| Coherence and Cohesion | 6.5 |
| Lexical Resource | 6.0 |
| Grammatical Range and Accuracy | 6.0 |
| Overall | 6.5 |
Task Achievement / Task Response: Band 6.5
You cover both visuals and identify the main user group correctly: full-time undergraduates account for 44%, while academic staff are the smallest group at 7%. You also report several satisfaction figures accurately, including the 95% very satisfied with staff helpfulness and the 20% dissatisfied with journals. The overview is relevant, but “not everyone is satisfied with all the facilities” is broad and does not highlight the strongest overall pattern: staff helpfulness and opening hours receive particularly positive ratings, whereas journals and Wi-Fi attract the most dissatisfaction. There is also a factual imprecision: you say nobody is dissatisfied with opening hours, but do not report that 65% are very satisfied and 35% fairly satisfied. More selective comparison and a fuller overview would strengthen the response.
Coherence and Cohesion: Band 6.5
The response has a clear overall arrangement: an introduction and overview are followed by separate discussion of the chart and table. This makes the two data sets easy to distinguish, and sequencing phrases such as “Looking at the chart” and “However, the table” help guide the reader. Some linking is mechanical, however, and the repeated use of “the remaining” in the table paragraph makes the reporting feel list-like. The overview also does not fully prepare the reader for the key comparisons developed later. Grouping the satisfaction results by positive ratings and dissatisfaction, then comparing the strongest and weakest aspects, would create more progression. Use references such as “this figure” or “the latter” only where their meaning is unmistakable.
Lexical Resource: Band 6.0
You use an adequate range of task-related vocabulary, including “categories,” “amounts to,” “dissatisfaction,” and “reliability,” and the meaning is generally clear. There are attempts at more formal reporting, but several choices are awkward or imprecise: “making up 44% of the total users,” “add 16% in the library users,” and “most non satisfactory aspect” do not sound natural in this context. “Shockingly” is also too subjective for an academic data summary. Repeated use of “users” and “satisfied” limits flexibility. Aim for precise collocations such as “accounted for,” “represented,” and “the highest proportion of dissatisfaction,” and use neutral language to describe the figures.
Grammatical Range and Accuracy: Band 6.0
You use both simple and more developed sentence forms, and most of the information remains understandable. For example, the sentence beginning “Dissatisfaction in the availability of books…” combines several figures, while the opening overview uses a contrast between user groups and satisfaction. Some grammatical errors remain, including missing articles in “use library” and “in the library users,” and awkward number or noun forms in “the highest number of library users are” and “full time post graduates.” The sentence “no one is dissatisfied with the opening hours” is also attached to the previous statement in a way that makes the relationship between the figures less clear. Check articles, plural forms, and sentence boundaries, and vary structures while keeping comparisons grammatically controlled.
See this exact question answered at other band scores. The same prompt compared across bands.
Browse more IELTS Writing model answers or get your own writing scored by the same AI examiner.