Band 5.5 IELTS Writing Task 1 Model Answer
Overall Band Score: 5.5 · Cambridge IELTS 21 · 2026-11-07
IELTS Writing Task 1 question
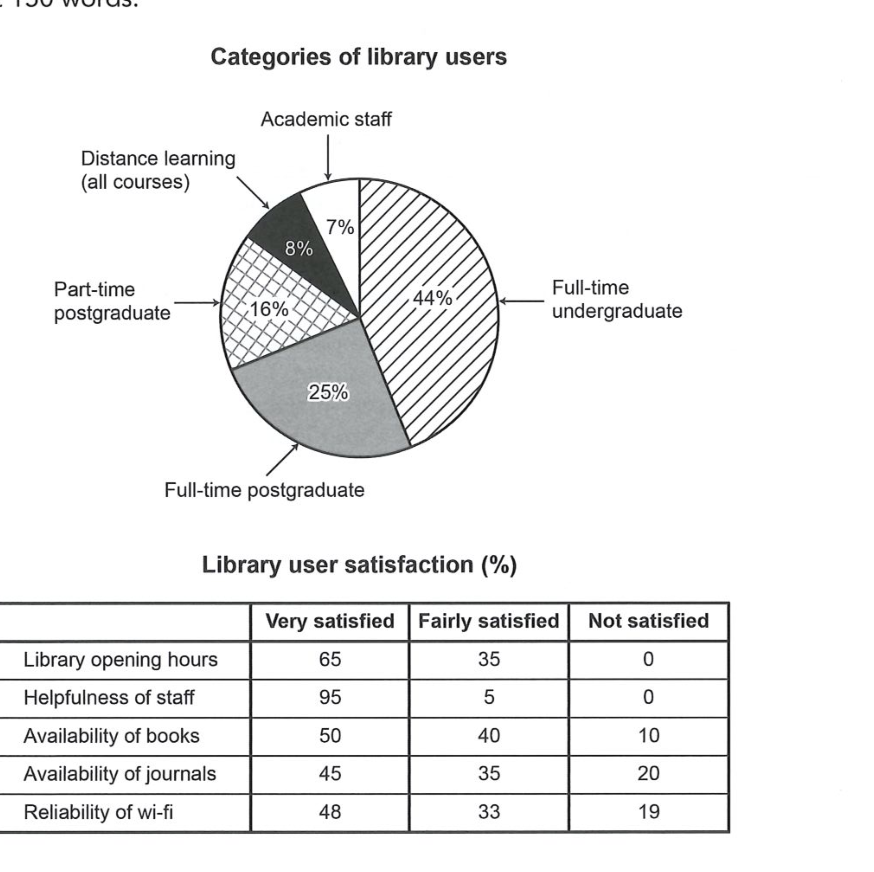
The chart and table below show the results of a survey of library users at a university.
Summarise the information by selecting and reporting the main features, and make comparisons where relevant.
Categories of library users
Student answer (Band 5.5)
The pie chart illustrates the comparison of different categories of library users, showing how large numbers of users fall in different categories by percentage wise. Then we have another table that shows library user satisfaction in different classes.
Overall, the pie chart has five different categories of library users that are interested in according to their roles. Largest number by percentage wise is Full-time undergraduate programe students that is exactly 44 percent. Secondly, Full-time postgraduate program contains its place with 25 percent after the Full-time undergraduate category. Then there is large declined of 16 percent on which Part-time postgraduate category falls. lastly there is slightly difference between last and second last category which is 8 and 7 percent distance learning and Academic staff, respectively.
On the other hand, the second table showing the five different categories of library user satisfaction which is then classified in three different classes of very satisfied, Fairly satisfied and Not satisfied. Mostly sixty five Library users are very satisfied with opening hours of library, thirty five users are fairly satisfied and no one is Not satisfied with opening library hours. Then Helpfulness of staff is much more very satisfied
AI examiner evaluation
| Criterion | Band |
|---|---|
| Task Achievement / Task Response | 5.0 |
| Coherence and Cohesion | 5.5 |
| Lexical Resource | 5.5 |
| Grammatical Range and Accuracy | 5.0 |
| Overall | 5.5 |
Task Achievement / Task Response: Band 5.0
You identify the main user groups and correctly report the largest shares: full-time undergraduates at 44% and full-time postgraduates at 25%. You also note the satisfaction categories and accurately describe the opening-hours results. However, the response only partially summarises the table: it stops after introducing staff helpfulness and gives no figures for that feature or for books, journals, and Wi-Fi. These omitted results include important contrasts, such as staff helpfulness receiving 95% very satisfied and journals having the highest dissatisfaction at 20%. The overview is also limited to ranking user groups rather than highlighting the broad satisfaction pattern. To strengthen the response, cover the full table and select its most notable comparisons.
Coherence and Cohesion: Band 5.5
The response has a recognisable structure: an introduction, a paragraph about user categories, and a transition to satisfaction results. This gives the reader some sense of the two visuals being discussed. However, progression is incomplete because the final paragraph ends after the staff-helpfulness point, leaving most of the table unreported. Linking phrases such as “Overall” and “On the other hand” help signal shifts, but some connections are awkward or repetitive, and the long opening sentences combine several ideas without clear control. Organise the response into a concise overview followed by logically grouped details, and use transitions to show comparisons between satisfaction measures rather than simply moving from one item to another.
Lexical Resource: Band 5.5
You use relevant task vocabulary, including “categories,” “percentage,” “satisfaction,” and “classified,” and the reader can generally understand which groups and measures you mean. However, several expressions are unnatural or imprecise, such as “by percentage wise,” “contains its place,” and “there is large declined of 16 percent.” Repetition of “category” and “satisfied” also limits the range, while “program” is misspelled as “programe.” Aim for standard chart language and accurate collocations: for example, say that a group “accounted for” a share, or that satisfaction “was highest” for a feature. More precise vocabulary would make comparisons clearer and more concise.
Grammatical Range and Accuracy: Band 5.0
The response attempts both simple and longer sentence forms, and some basic statements communicate the data, such as “Full-time postgraduate program contains its place with 25 percent.” However, many sentences have faulty structures that make the relationships between ideas difficult to follow. For example, “Largest number by percentage wise is Full-time undergraduate programe students that is exactly 44 percent” lacks a clear grammatical frame, while “Then Helpfulness of staff is much more very satisfied” is incomplete and does not express a clear comparison. Articles, agreement, and sentence boundaries are also inconsistent. Practise building accurate comparison sentences, such as “The largest group was full-time undergraduates, at 44%,” and check each sentence for a complete subject and verb.
See this exact question answered at other band scores. The same prompt compared across bands.
Browse more IELTS Writing model answers or get your own writing scored by the same AI examiner.