Band 6.0 IELTS Writing Task 1 Model Answer
Overall Band Score: 6.0 · Cambridge IELTS 21 · 2026-11-07
IELTS Writing Task 1 question
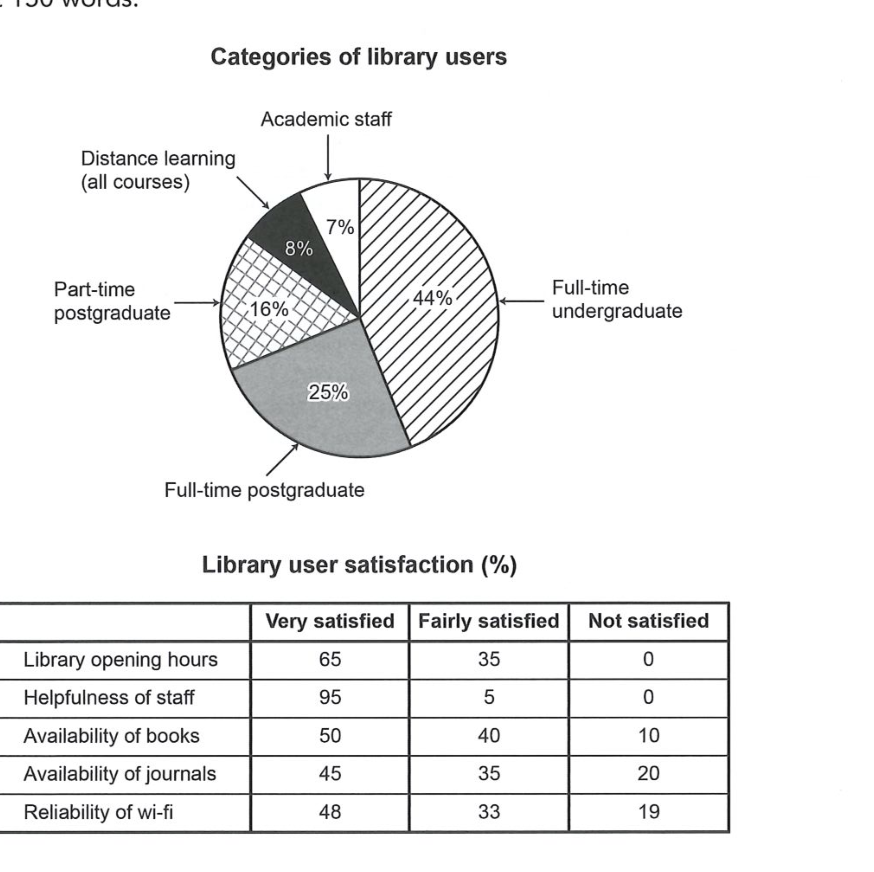
The chart and table below show the results of a survey of library users at a university.
Summarise the information by selecting and reporting the main features, and make comparisons where relevant.
Categories of library users
Student answer (Band 6.0)
The pie chart illustrates about the categories of library users while, the table provides for the level of satisfaction with the five aspects of library services.
Overall, the chart has largest proportion of undergraduate students, whereas the smallest accounts for academic staff. Regarding the level of satisfaction , helpfullness of the library staff has highest rating, while availability of journal attracted the most dissatisfaction.
According to the pie chart, full time undergraduate student makes up to 44% of library users, followed by 25% of full time postgraduate students. Part time postgraduate accounts for 16% , while distance learning represents 8%. Academic staff constitutes about 7 %.
Turning to the chart, 95% satisfied by the helpfullness of staff making it the most rated aspect of the all, while library opening hours recieved mixed signals, with 65% satisfied and 35% fairly satisfied.
Moving on, availability of books received 50% of satisfied ,40% dissatisfied users and 10% not satisfied. Similarly availability of journals rates at 45% satisfied ,35% dissatisfied and 20% not satisfied. Furthermore, the reliability of Wifi recieves 48% satisfied and 33 % dissatisfied and 19% not satisfied.
In conclusion, most library services receive favourable feedback while availability of journal and better Wifi service could benefit from improvement.
AI examiner evaluation
| Criterion | Band |
|---|---|
| Task Achievement / Task Response | 6.5 |
| Coherence and Cohesion | 6.5 |
| Lexical Resource | 6.0 |
| Grammatical Range and Accuracy | 5.5 |
| Overall | 6.0 |
Task Achievement / Task Response: Band 6.5
You cover both visuals and give a clear overview, identifying undergraduates as the largest user group and academic staff as the smallest, as well as staff helpfulness as the strongest satisfaction result and journals as the weakest. Most figures are reported accurately. However, the table is misread in several places: for books, 40% were fairly satisfied and 10% not satisfied, not 40% dissatisfied; the same category error affects journals and Wi-Fi. Opening hours are also described as “mixed signals,” although the figures show 65% very satisfied and 35% fairly satisfied, with no dissatisfaction. The final comment about improving Wi-Fi is not well supported because its dissatisfaction rate is below that for journals. Accurate category labels and more precise comparisons would make the report more complete.
Coherence and Cohesion: Band 6.5
The response has a recognisable structure: an introduction, an overview, separate paragraphs for the user categories and satisfaction data, and a concluding comment. This gives the reader a coherent overall route through the information. Linking phrases such as “According to,” “Turning to,” and “Moving on” help signal shifts, although their repeated use makes the progression somewhat mechanical. The final paragraph also repeats the earlier comparison rather than adding a useful synthesis. More importantly, the table paragraph groups figures together without consistently distinguishing “very satisfied,” “fairly satisfied,” and “not satisfied,” which weakens the clarity of the comparisons. Use the table’s categories explicitly and organise the satisfaction results into meaningful contrasts to make cohesion more precise.
Lexical Resource: Band 6.0
You use a reasonable range of task-related vocabulary, including “proportion,” “constitutes,” “dissatisfaction,” and “reliability,” and the meaning is generally clear. There are also attempts to vary reporting language, such as “makes up,” “accounts for,” and “represents.” However, some word choices and collocations are inaccurate or awkward: “the most rated aspect” and “mixed signals” do not describe the data naturally, while “availability of journal” needs a plural form. “Satisfied” is also used too broadly for both very and fairly satisfied responses, contributing to imprecise reporting. Spelling errors such as “helpfullness,” “recieved,” and “Wifi” reduce accuracy. Aim for precise chart language and check spelling and collocations before submitting.
Grammatical Range and Accuracy: Band 5.5
You attempt a mix of simple and more complex sentence forms, including a contrast in “the chart has largest proportion … whereas the smallest accounts for academic staff.” The overall meaning is usually recoverable, but some grammatical errors recur. Articles and sentence structure are problematic in “the chart illustrates about the categories” and “the table provides for the level”; these could be expressed as “illustrates the categories” and “shows satisfaction levels.” Several data statements lack a clear verb or subject, for example “95% satisfied by the helpfulness of staff,” and “full time undergraduate student makes up to 44%” has an awkward subject–verb construction. Commas and spacing around punctuation are inconsistent. Build complete clauses and check articles, agreement, and punctuation to improve control.
See this exact question answered at other band scores. The same prompt compared across bands.
Browse more IELTS Writing model answers or get your own writing scored by the same AI examiner.