Band 5.5 IELTS Writing Task 1 Model Answer
Overall Band Score: 5.5 · Cambridge IELTS 21 · 2026-11-07
IELTS Writing Task 1 question
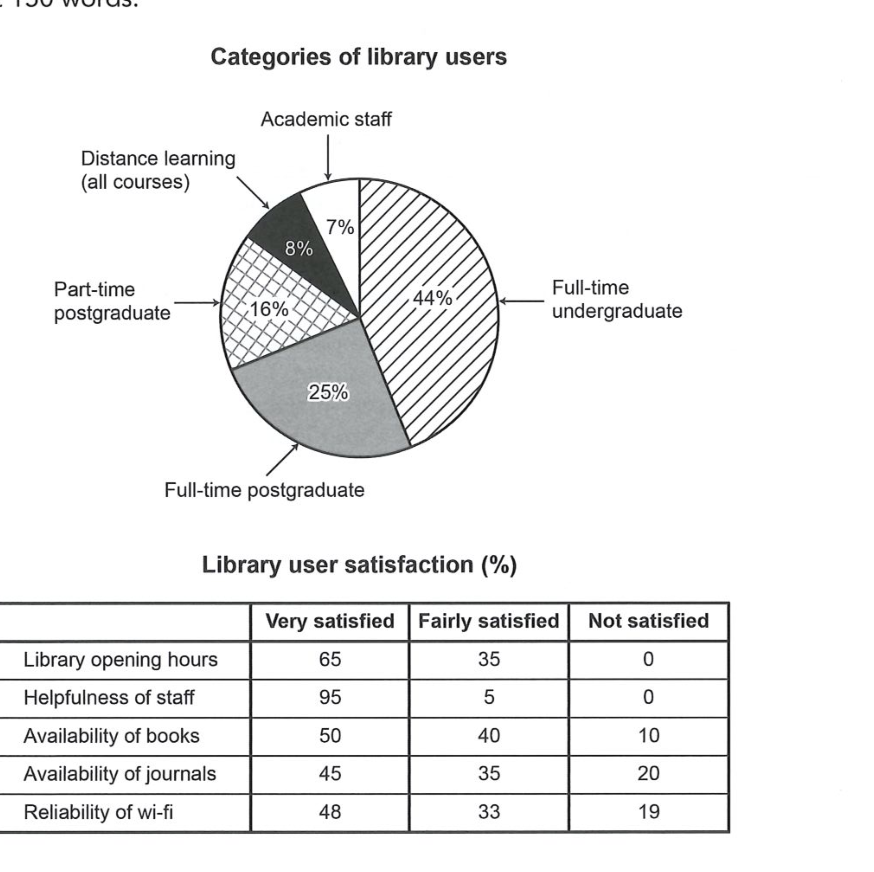
The chart and table below show the results of a survey of library users at a university.
Summarise the information by selecting and reporting the main features, and make comparisons where relevant.
Categories of library users
Student answer (Band 5.5)
The pie chart illustratesthe results of a study of library attendants at a higher education establishment.
Overall, the biggest number of library users consists of full-time students. About two thirds of the whole population studied while meerly less than half of all the categories show unsatisfactory levels.
Two thirds of the users are students, mostly full-time undergraduates and postgraduates respectively. Which speaks for itself for this category, these categories consist the biggest number of users mainly due to their studies and researches required for their programmes as full-time students. Unlike part-time postgraduates that occupy 16 percent, which most of their time is invested into work to earn some pocket money possibly. Whilst the rest represent less than 15 percent.
The satisfaction rate is displayed as follows, for library opening hours and the helpfulness of staff most users show very satisfying results. Nevertheless the availability of books is split into two sections of the same level of satisfaction, very satisfied occup 50 percent and 40 percent are failry satisfied while 10 percent are not. the level of unsatisfaction increases to 20 percent with the availability of journals and 19 percent with the wif-fi reliability respectively.
AI examiner evaluation
| Criterion | Band |
|---|---|
| Task Achievement / Task Response | 5.5 |
| Coherence and Cohesion | 5.5 |
| Lexical Resource | 5.5 |
| Grammatical Range and Accuracy | 5.0 |
| Overall | 5.5 |
Task Achievement / Task Response: Band 5.5
The response identifies several relevant features, including the dominance of full-time undergraduates (44%), the relatively high satisfaction with staff helpfulness, and the greater dissatisfaction with journals and Wi-Fi. However, the overview is partly inaccurate: “About two thirds” refers to students, but the two postgraduate groups plus undergraduates total 85%, while undergraduates alone account for 44%. The claim that “less than half” of categories show unsatisfactory levels is unclear and does not accurately summarise the table; dissatisfaction is zero for two aspects and highest for journals at 20%. Some explanations about users’ studies, research and work are speculative rather than chart-based. Report the main comparisons more precisely and avoid unsupported reasons.
Coherence and Cohesion: Band 5.5
The response has a recognisable structure, moving from an introduction and overview to user categories and then satisfaction results. This gives the reader a basic route through the information. However, progression within paragraphs is uneven, and some links are unclear. For example, “Which speaks for itself for this category” does not clearly connect to the preceding point, while “Unlike part-time postgraduates…” introduces an unsupported contrast. The final paragraph lists several satisfaction figures but does not consistently compare them or distinguish the strongest and weakest results. Use clearer topic sentences and organise the data into two focused sections, with comparisons grouped logically. Check that linking words such as “Nevertheless” and “Whilst” express the relationships intended.
Lexical Resource: Band 5.5
There is enough vocabulary to describe the chart, including “satisfaction rate,” “availability,” “reliability,” and “occupy 16 percent,” and the main subject remains understandable. However, word choice and collocation are often inaccurate or awkward, which limits precision: “library attendants” is not the same as library users, “the whole population studied” is vague, and “very satisfying results” should describe users’ satisfaction rather than the results themselves. “Unsatisfactory levels” and “level of unsatisfaction” are also unnatural in this context. Spelling slips such as “meerly,” “failry,” and “wif-fi” are noticeable. Prefer standard chart language such as “account for,” “respondents,” and “dissatisfied,” and proofread spelling carefully.
Grammatical Range and Accuracy: Band 5.0
The response attempts some complex structures, but control is inconsistent and errors sometimes make relationships difficult to follow. The fragment “Which speaks for itself for this category” cannot stand as a complete sentence, and “Unlike part-time postgraduates that occupy 16 percent” is also incomplete. In “most users show very satisfying results,” the sentence structure does not clearly express who is satisfied. There are also problems with sentence boundaries and punctuation, including the lower-case “the” after a full stop and the long final sentence joined by commas. Aim for complete, direct sentences and use subordination only when the clause is grammatically complete. For example, state the user proportions in one sentence, then compare satisfaction figures in separate sentences.
See this exact question answered at other band scores. The same prompt compared across bands.
Browse more IELTS Writing model answers or get your own writing scored by the same AI examiner.