Band 5.5 IELTS Writing Task 1 Model Answer
Overall Band Score: 5.5 · Cambridge IELTS 21 · 2026-11-08
IELTS Writing Task 1 question
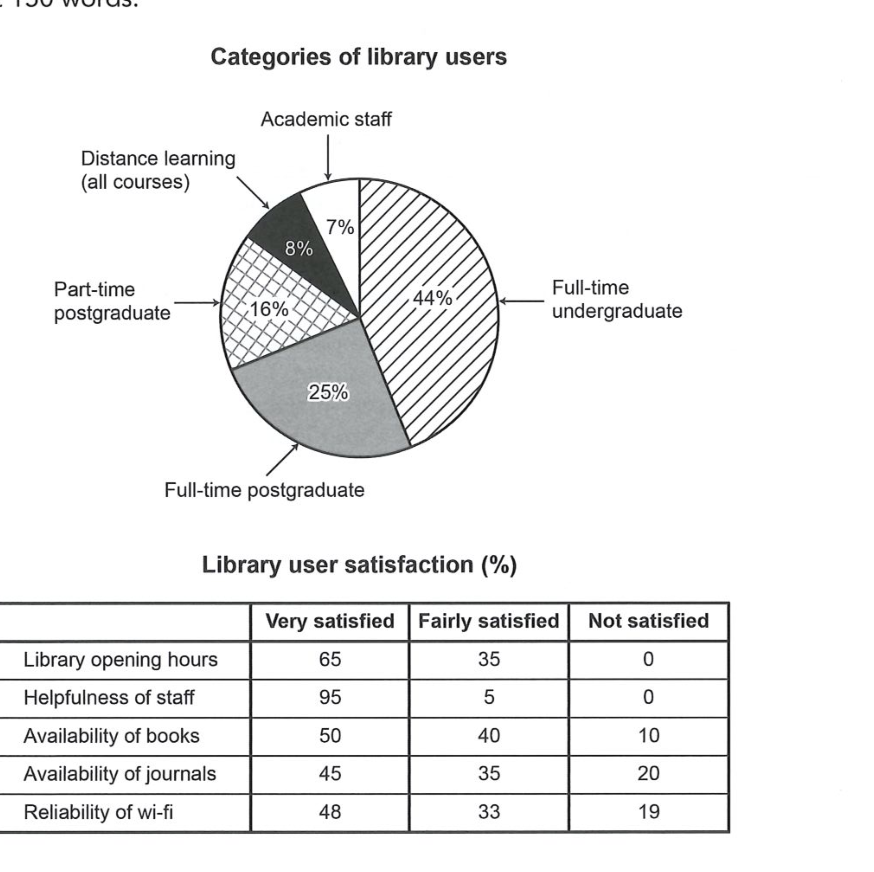
The chart and table below show the results of a survey of library users at a university.
Summarise the information by selecting and reporting the main features, and make comparisons where relevant.
Categories of library users
Student answer (Band 5.5)
The pie chart demonstrates the categories of library users on the other hand the table presents the amenities provides in library.
Libraby is most used by full-time undergradauate which is 44% and 25% used by the full -time postgraduate scholars which covers the most of the users of library by 69% remaing 31% slpits in 3 categories which is part time postgraduate students whihc is 18%, distance learner which covers 8% and the least cover the academic staff by 7%
Now the reviews from the users of there satisfaction of the library, the users was most satisfied by helpfullness of staff 95% are very satisfied only 5% users were fairly satisfied ,there were 0% of users which are not satisfied, and from opening hours 65% are verysatified and 35% was fairly satisfed and again tehre aare 0% of users which are not satisfied.
Highest number of users were not satisfied in availability of journals which is 20% only 35% are fairly satisfied and 45% are very satisfied, athough reliabilty of wifi were also not satisfied by users by 19% and 33% were fairly satisfied and 48% are very satisfied.
AI examiner evaluation
| Criterion | Band |
|---|---|
| Task Achievement / Task Response | 5.0 |
| Coherence and Cohesion | 6.0 |
| Lexical Resource | 5.5 |
| Grammatical Range and Accuracy | 5.0 |
| Overall | 5.5 |
Task Achievement / Task Response: Band 5.0
You identify the main user group correctly: full-time undergraduates account for 44%, and you note that staff are the smallest group at 7%. You also report several satisfaction figures accurately, including the strong result for staff helpfulness and the 20% dissatisfied with journal availability. However, the response does not fully summarise the main features: it gives no clear overall comparison of satisfaction across all five services, and it omits the book-availability figures entirely. There is also a factual error: part-time postgraduates are 16%, not 18%. The opening sentence describes the visuals but does not provide an overview of their key patterns. Select the most notable highs and lows, include the missing category, and check every figure against the chart.
Coherence and Cohesion: Band 6.0
The response has a recognisable overall arrangement: it first discusses user categories and then moves to satisfaction, with separate paragraphs for the two visuals. This helps the reader follow the broad topic. Within paragraphs, however, ideas are often joined in long strings, particularly the user-category paragraph, where several figures and groups are linked with repeated “and” and “which.” The transition “Now the reviews” is understandable but informal, and “on the other hand” does not express a meaningful contrast between the chart and table. Use clearer topic sentences and group related comparisons—for example, the two highest satisfaction results together, then the lower ratings—to make progression more deliberate and cohesion less mechanical.
Lexical Resource: Band 5.5
You use some task-relevant vocabulary, including “categories,” “satisfied,” “fairly satisfied,” and “not satisfied,” so the reader can understand the subject and many comparisons. However, the range is limited and several choices are inaccurate or informal: “amenities provides” is not a natural description of the table, “reviews” is less precise than “satisfaction ratings,” and “covers” is repeatedly used where “accounts for” would be clearer. Spelling errors such as “Libraby,” “undergradauate,” “slpits,” and “reliabilty” are noticeable and sometimes slow reading. Use precise terms for the data and check spelling carefully; avoid repeating the same general verbs when describing proportions.
Grammatical Range and Accuracy: Band 5.0
The response attempts some longer sentences and uses basic comparison structures, but control is uneven. Several sentences contain faulty clause construction, as in “the table presents the amenities provides in library,” and “which covers the most of the users … by 69%.” Subject–verb agreement and verb forms are also problematic in “the users was most satisfied” and “35% was fairly satisfied.” Articles and sentence boundaries are often missing, while commas join multiple independent ideas into run-on sentences. These errors sometimes make relationships between figures difficult to follow. Build shorter, complete sentences first, then add a limited number of accurate complex clauses; check agreement, articles, and punctuation when editing.
See this exact question answered at other band scores. The same prompt compared across bands.
Browse more IELTS Writing model answers or get your own writing scored by the same AI examiner.