Band 6.0 IELTS Writing Task 1 Model Answer
Overall Band Score: 6.0 · Cambridge IELTS 21 · 2026-11-08
IELTS Writing Task 1 question
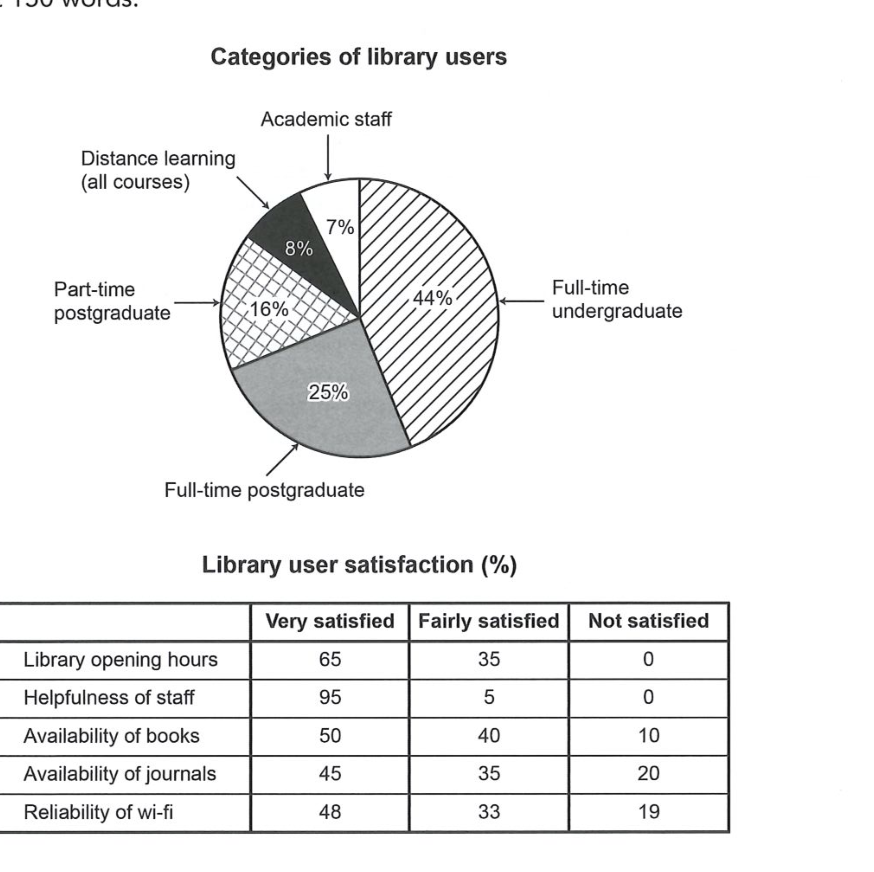
The chart and table below show the results of a survey of library users at a university.
Summarise the information by selecting and reporting the main features, and make comparisons where relevant.
Categories of library users
Student answer (Band 6.0)
This picture of one chart and one table represent the categories of library users and the library user satisfaction in pourcentage.
In the chart we can see that almost half of the users are full time undergraduade with 44% and the lower amount of people are academic staff user with only 7%. The second category of people using the library often are full-time postgraduate with 25%.
These also two other category in minority :
-Distance learning all courses, only 8% wich is 1% more than the academic staff
-part-time postgraduate wiht 16%
That mean the library is using by mostly full-time students either graduate or not with a total of 69%.
In the table, the biggest number is for the Helpfulness of staff with 95% of user very satisfied and 5% farily satisifed but 0% of not satisfied, wich is a great point for the staff.
The biggest problem woulb be the availability of journals, 20% are not satisfied, 35% fairly satisfied and 45% very satisfied. The availability of books seems a little bit better with 50% very satisfied wich is half of the users.
The second problem would be the wi-fi beceause 19% of the users are not satisfied.
The opening hours of the librabry seems good for the users with 65% satisfied and 35% farily satisfied.
In conclusion, the library has good reviews from the customers and can change only small things to have better reviews ands give the users a better experience.
AI examiner evaluation
| Criterion | Band |
|---|---|
| Task Achievement / Task Response | 6.5 |
| Coherence and Cohesion | 6.0 |
| Lexical Resource | 5.5 |
| Grammatical Range and Accuracy | 5.0 |
| Overall | 6.0 |
Task Achievement / Task Response: Band 6.5
You cover both visuals and identify several important features accurately: undergraduates are the largest user group at 44%, academic staff the smallest at 7%, and staff helpfulness receives the strongest satisfaction ratings. You also compare journals and books and note the 19% dissatisfied with Wi-Fi. The overview that most users are full-time students is supported by the figures, although the 69% total is not clearly explained as the combined undergraduate and postgraduate groups. Some reporting is less precise: opening hours are described as “65% satisfied,” rather than specifying that 65% are very satisfied and 35% fairly satisfied. The conclusion about “good reviews” is broad; a sharper overview contrasting strong staff and opening-hours ratings with weaker journal and Wi-Fi ratings would complete the summary more effectively.
Coherence and Cohesion: Band 6.0
The response has a coherent overall arrangement: it introduces the visuals, discusses user categories, then satisfaction results, and ends with a conclusion. This makes the main information easy to locate. Paragraphing generally supports this sequence, and comparisons such as “The availability of books seems a little bit better” help connect related data. However, some links are mechanical or unclear. “These also two other category in minority” does not smoothly introduce the remaining groups, and the dash-led list interrupts the paragraph’s flow. The final conclusion repeats the general idea of positive reviews rather than synthesising the key contrasts. Use clearer transitions between the two visuals and group related satisfaction results into a more deliberate progression.
Lexical Resource: Band 5.5
You use enough topic vocabulary to communicate the main data, including “full-time undergraduate,” “availability of journals,” “very satisfied,” and “not satisfied.” There are also attempts at evaluative language such as “biggest problem” and “better,” but these are broad and sometimes informal for an academic report. Several noticeable spelling and word-choice errors reduce precision, including “pourcentage,” “undergraduade,” “farily,” and “reviews from the customers.” Some phrases are awkward, such as “the library is using by mostly full-time students,” and “the lower amount of people” is not a natural way to describe a category’s share. Aim for accurate collocations and more precise terms such as “proportion,” “respondents,” and “dissatisfaction.”
Grammatical Range and Accuracy: Band 5.0
You attempt both simple and more extended sentence forms, and the meaning is usually recoverable. For example, the comparison of the journal and book ratings is understandable, and the response uses clauses with “with” and “because.” However, grammatical control is uneven, with errors in agreement, articles, word order, and sentence construction. “This picture of one chart and one table represent” has a singular subject with a plural verb, while “the library is using by mostly full-time students” has an incorrect passive construction. “That mean” also needs subject–verb agreement, and “These also two other category” is structurally incomplete. Build accuracy first in straightforward reporting sentences, then add complex clauses only when their grammar is secure.
See this exact question answered at other band scores. The same prompt compared across bands.
Browse more IELTS Writing model answers or get your own writing scored by the same AI examiner.