Band 6.5 IELTS Writing Task 1 Model Answer
Overall Band Score: 6.5 · Cambridge IELTS 21 · 2026-11-08
IELTS Writing Task 1 question
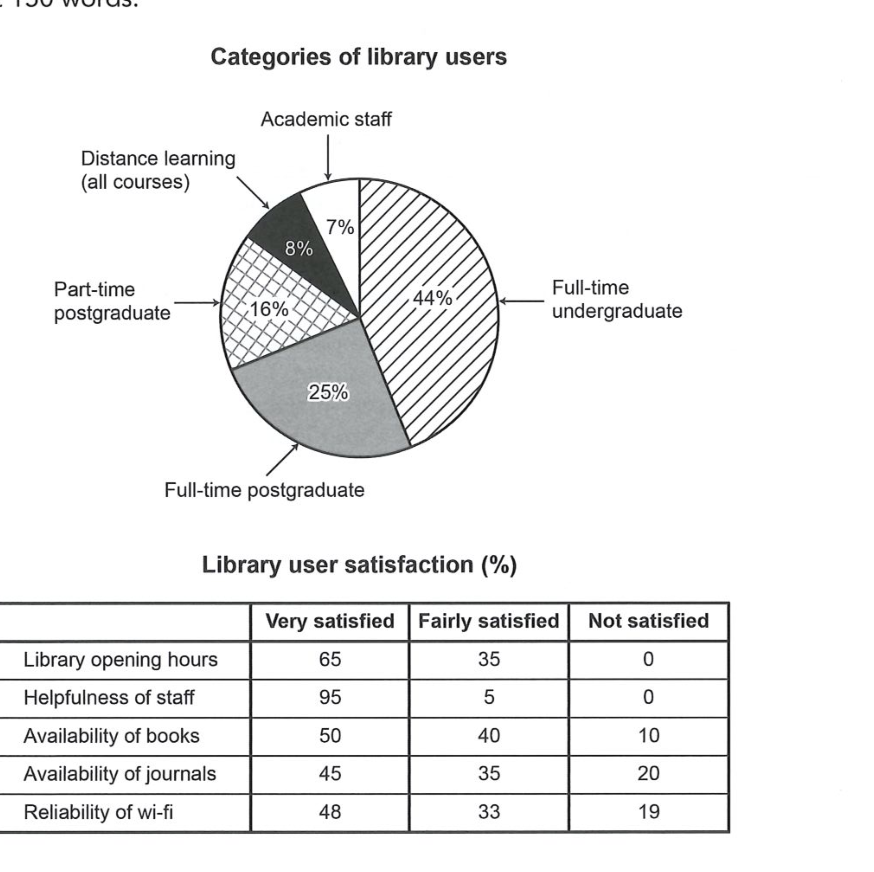
The chart and table below show the results of a survey of library users at a university.
Summarise the information by selecting and reporting the main features, and make comparisons where relevant.
Categories of library users
Student answer (Band 6.5)
The pie chart displays what percentage of users of differents categories use the library and the table shows the user satisfaction for different services of the library quantitavely in three categories.
Overall, the library is used mostly by the full-time undergraduate students of the university and academic staffs use the library least. And the users are most satisfied with the services of the library staffs, whereas, the users are least satisfied with the availability of the journals.
Full-time undergraduate students are the highest user of the library with 44% shares of the total users. Full-time and part-time postgraduate students have 25% and 16% users of the total users respectively. There are also distance learners and academic staffs, respectively having 8% and 7% of total users.
The satisfaction of the users is categorized in three categories, "very satisfied", "fairly satisfied", and "not satisfied". The users are most satisfied with the library staff as 95% of the users are very satisfied and 5% of the users are fairly satisfied with the service.10% and 20% of users are not satisfied with the availability of books and journals and 19% of the users are not satisfied with the reliablity of the wifi. 100% of the users are satisfied with library opening hours where 65% users are very satisfied.
AI examiner evaluation
| Criterion | Band |
|---|---|
| Task Achievement / Task Response | 7.0 |
| Coherence and Cohesion | 6.5 |
| Lexical Resource | 6.0 |
| Grammatical Range and Accuracy | 6.0 |
| Overall | 6.5 |
Task Achievement / Task Response: Band 7.0
The response identifies the main pattern in both visuals and gives a clear overview: undergraduates form the largest user group, academic staff the smallest, and staff helpfulness receives the strongest satisfaction ratings while journals receive the weakest. The reported user-group percentages are accurate, and the comparisons about opening hours and dissatisfaction with books, journals and Wi-Fi are supported by the table. This covers the task well, though some information is less fully developed: the response omits the fairly satisfied and not satisfied figures for books, journals and Wi-Fi, and does not compare satisfaction across all five services in a balanced way. For example, it could highlight that books have the highest very-satisfied share after staff helpfulness, while journals have the highest dissatisfaction.
Coherence and Cohesion: Band 6.5
The response has a coherent overall arrangement: it introduces the visuals, presents an overview, then describes user categories and satisfaction. This gives the reader a clear route through the information, and linking expressions such as “Overall,” “whereas,” and “respectively” help connect comparisons. The paragraphing is also appropriate. However, some connections are mechanical or unclear. The overview’s sentence beginning “And the users…” is an awkward continuation, while “The satisfaction of the users is categorized in three categories” repeats the same idea without advancing the comparison. The final paragraph also moves quickly between several services. To strengthen progression, group the satisfaction data into positive ratings and dissatisfaction, and use clearer references when moving from one service to another.
Lexical Resource: Band 6.0
There is adequate vocabulary for describing the visuals, including “percentage,” “satisfaction,” “categorized,” and “respectively.” The writer also attempts more formal reporting language, and the meaning is generally clear. However, some word choices and collocations are inaccurate or unnatural, such as “44% shares of the total users,” “25% and 16% users,” and “library staffs.” Spelling errors in “differents,” “quantitavely,” and “reliablity” also reduce accuracy. “Services of the library staffs” is imprecise because the table concerns helpfulness of staff, not services provided by staff. Aim for standard chart-reporting phrases such as “account for,” “the proportion of users,” and “staff helpfulness,” and check spelling carefully.
Grammatical Range and Accuracy: Band 6.0
The response uses a mix of simple and more complex sentence forms, including comparisons with “whereas” and clauses introduced by “as.” Most sentences communicate the intended information, and the overall meaning remains clear. Some grammatical errors nevertheless occur. In “Full-time undergraduate students are the highest user,” the singular noun does not agree with the plural subject, and “academic staffs use the library least” has an awkward plural construction. The sentence “100% of the users are satisfied with library opening hours where 65% users are very satisfied” uses “where” incorrectly to connect the figures and omits an article before “65% users.” There are also punctuation and spacing issues, such as “service.10%.” Review agreement, articles, and sentence boundaries, while varying structures without making comparisons difficult to follow.
See this exact question answered at other band scores. The same prompt compared across bands.
Browse more IELTS Writing model answers or get your own writing scored by the same AI examiner.