Band 5.5 IELTS Writing Task 1 Model Answer
Overall Band Score: 5.5 · Cambridge IELTS 21 · 2026-11-08
IELTS Writing Task 1 question
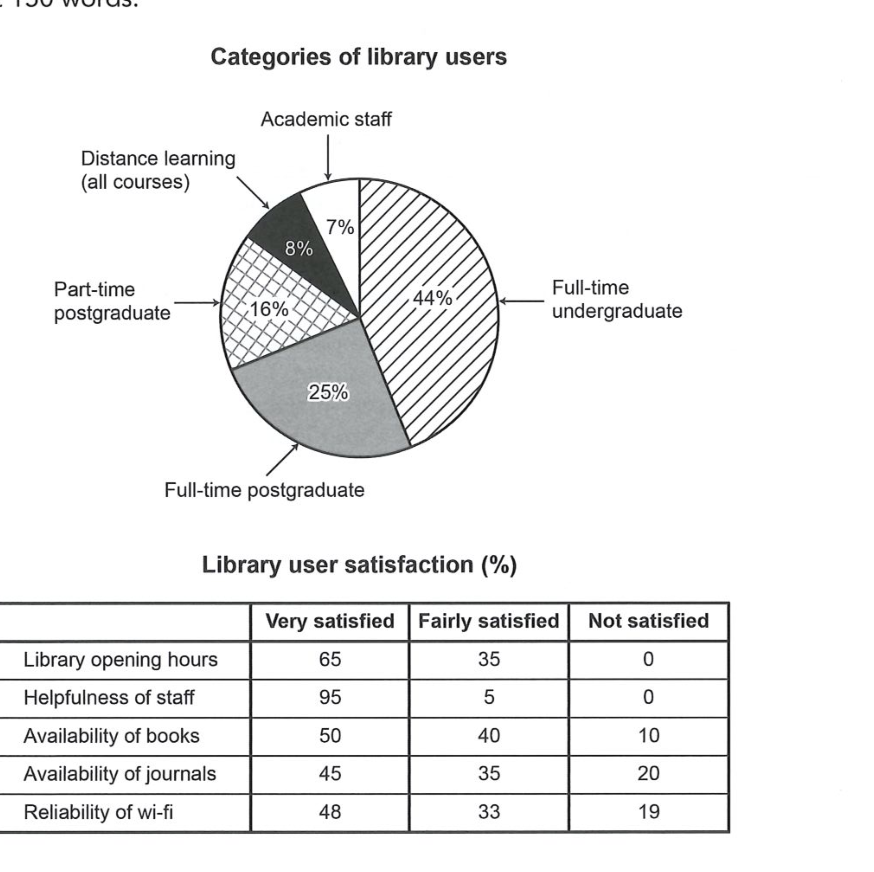
The chart and table below show the results of a survey of library users at a university.
Summarise the information by selecting and reporting the main features, and make comparisons where relevant.
Categories of library users
Student answer (Band 5.5)
The graph and table illustrates the outcomes of a survey of library users at a university.
Overall, pie chart represents the categories of library visitors whereas, table indicates the level of their satisfaction. Additionally, table allows users to select one of three levels for their services such as very satisfied, fairly satisfied and not satisfied.
Firstly, full-time undergraduates accounted for highest percentage of 44% in a chart. Moreover, full-time postgraduates represents more percentage of 9% for visiting library in comparison with part-time postgraduates who uses library 16%. The number of distance learners stood at 8%, while academic staff showed smallest proportion of 7%.
Secondly, from the table survey indicates that almost 95% of people are vey satisfied with helpfulness of staff, 5% are fairly satisfied and no one is not satisfied. Furthermore, with library opening hours 65% of people are ery satisfied, 35% are fairly satisfied and similar to previous service no one is no satisfied. Availibility of journals and reliability of wifi had 20% and 19% not satisfied users respectivily.
AI examiner evaluation
| Criterion | Band |
|---|---|
| Task Achievement / Task Response | 5.5 |
| Coherence and Cohesion | 6.0 |
| Lexical Resource | 5.5 |
| Grammatical Range and Accuracy | 5.5 |
| Overall | 5.5 |
Task Achievement / Task Response: Band 5.5
You identify the two visuals and report several key figures accurately, including the 44% share of full-time undergraduates, the smallest groups, and satisfaction with staff and opening hours. However, one important figure is misreported: full-time postgraduates are 25%, not 9%. The response also gives little coverage of the remaining satisfaction results: books are omitted, and the figures for journals and Wi-Fi are mentioned only for dissatisfaction, without comparing the satisfied categories. The overview describes what each visual shows but does not summarise the main patterns, such as staff helpfulness receiving the strongest satisfaction and journals the highest dissatisfaction. More accurate selection and fuller comparison of the table’s main results would make the report more complete.
Coherence and Cohesion: Band 6.0
The response has a recognisable structure: an introduction and overview are followed by one paragraph on user categories and another on satisfaction. Sequencing with “Firstly” and “Secondly” helps the reader follow the shift between visuals. However, the overview mainly explains what the chart and table represent rather than establishing the key findings, so the progression from overview to details is not especially strong. Some linking is mechanical, and the long second detail paragraph moves through several services without a clear comparison or grouping. The phrase “Moreover” introduces a figure, but the comparison that follows is confusing because the postgraduate percentage is inaccurate. Organising satisfaction results into clear contrasts—for example, strongest approval versus greatest dissatisfaction—would improve cohesion.
Lexical Resource: Band 5.5
You use relevant task vocabulary such as “accounted for,” “proportion,” “satisfaction,” and “fairly satisfied,” and the reader can generally understand the intended comparisons. However, the range is somewhat limited, with repeated use of “people,” “percentage,” and “satisfied.” Several word-choice and spelling problems reduce precision, including “visiting library” for library use, “vey,” “ery,” “Availibility,” and “respectivily.” “The outcomes of a survey” is understandable, but “the results of a survey” is more natural in this context. Aim for accurate collocations and spelling, and use varied terms such as “share,” “respondents,” and “rated” where appropriate. This would make the description more precise and fluent.
Grammatical Range and Accuracy: Band 5.5
You attempt both simple and more developed sentence forms, and the main message is usually understandable. However, some errors in agreement, articles, and sentence construction remain. For example, “The graph and table illustrates” should use a plural verb, while “full-time postgraduates represents” also has incorrect agreement. In “full-time postgraduates who uses library,” the relative clause needs a plural verb and an article or possessive before “library.” The opening overview also has awkward punctuation and clause structure: “whereas, table indicates” should not place a comma after “whereas,” and needs “the table.” There is some variety, but greater control of these patterns and more carefully formed comparisons would improve accuracy.
See this exact question answered at other band scores. The same prompt compared across bands.
Browse more IELTS Writing model answers or get your own writing scored by the same AI examiner.