Band 6.0 IELTS Writing Task 1 Model Answer
Overall Band Score: 6.0 · Cambridge IELTS 21 · 2026-11-08
IELTS Writing Task 1 question
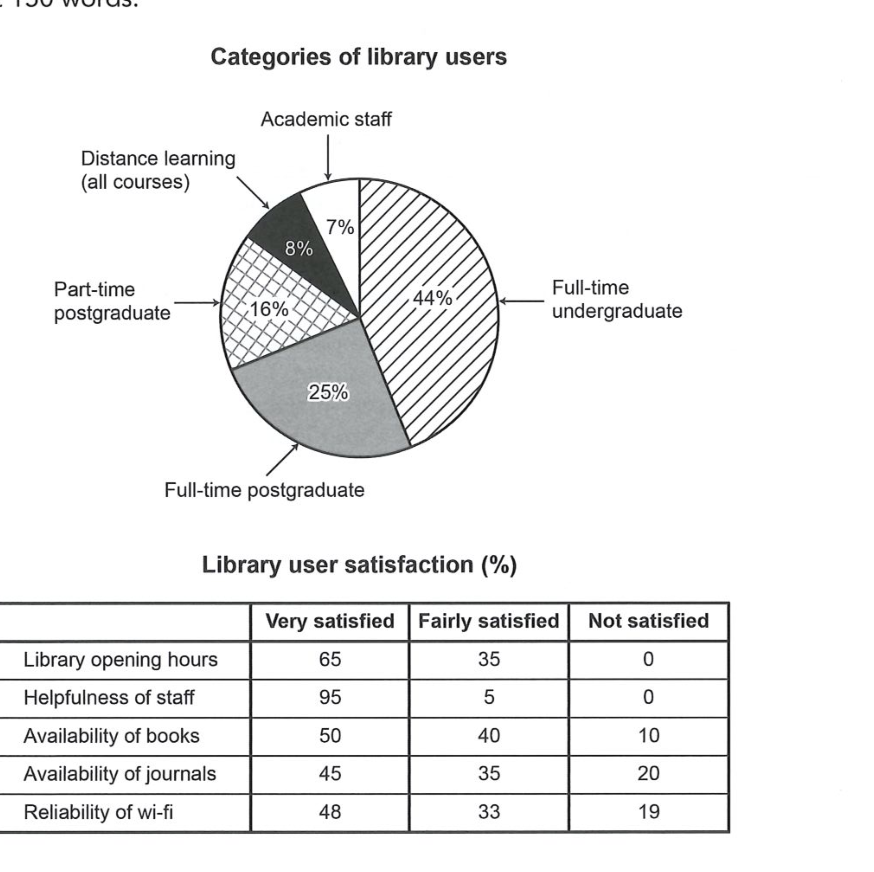
The chart and table below show the results of a survey of library users at a university.
Summarise the information by selecting and reporting the main features, and make comparisons where relevant.
Categories of library users
Student answer (Band 6.0)
The pie chart provides data on an university library's users categories and the table illustrates information on categories in which proportion of library user satisfaction are showing.
Overall highest percentage of library users are full-time undergraduate student and lowest proportion of users are academic staff. Whereas helpfulness of staff get highest satisfaction rate although journals availability isn't enough there to satisfied the users.
Looking at the pie chart, 44% of user of the library are full-time undergraduate students use, following that 25% of full-time postgraduate students use the library. Lowest library users are academic staffs which is 7% and second lowest are distance learning students from all courses which is 8%.
Turning to the table, 95% users are very satisfied with the staffs co-operativeness.In addition library openings hours are comprise 100% satisfied referred by the users. There is a limited availability of books as 10% users are not satisfied also journals are not mostly available as 20% users got dissatisfied. Wi-fi relliance is also not satisfied by 19% of users.
AI examiner evaluation
| Criterion | Band |
|---|---|
| Task Achievement / Task Response | 6.5 |
| Coherence and Cohesion | 6.5 |
| Lexical Resource | 5.5 |
| Grammatical Range and Accuracy | 5.5 |
| Overall | 6.0 |
Task Achievement / Task Response: Band 6.5
You identify the main user group accurately: full-time undergraduates account for 44%, while academic staff are the smallest group at 7%. You also select relevant satisfaction results, especially the 95% very satisfied with staff helpfulness and the 20% dissatisfied with journal availability. The overview gives a useful broad comparison, but the claim that opening hours are “100% satisfied” is imprecise: 65% are very satisfied and 35% fairly satisfied, with none dissatisfied. Some key comparisons are also underdeveloped, such as the 50% very satisfied with book availability and the wi-fi results. To strengthen the response, report the satisfaction categories precisely and compare the main patterns across the table rather than relying mainly on dissatisfaction figures.
Coherence and Cohesion: Band 6.5
The response has a clear overall structure: an introduction, an overview, then separate paragraphs for the chart and table. Sequencing phrases such as “Looking at the pie chart” and “Turning to the table” help readers follow the shift between visuals, and the main points are generally presented in a sensible order. However, some connections are awkward or unclear, particularly “Whereas helpfulness of staff get highest satisfaction rate although journals availability isn't enough there to satisfied the users.” The table paragraph also moves quickly between figures without consistently distinguishing very satisfied, fairly satisfied, and not satisfied. Use clearer links to show contrasts, and organise the table discussion around the strongest positive results and the areas with more dissatisfaction.
Lexical Resource: Band 5.5
You use relevant task vocabulary, including “proportion,” “satisfaction rate,” “availability,” and “dissatisfied,” and you attempt some less common phrasing such as “co-operativeness.” However, several word choices and collocations are inaccurate or unnatural, which makes parts of the report harder to interpret: “categories in which proportion of library user satisfaction are showing,” “journals availability isn't enough,” and “Wi-fi relliance.” There are also spelling and form errors, including “relliance” and “staffs.” Aim for precise, conventional chart language and avoid forcing elaborate expressions. For example, describe users as “accounting for” a percentage and say that users were “satisfied with” a service or “dissatisfied with” its availability.
Grammatical Range and Accuracy: Band 5.5
You attempt both simple and more complex sentence forms, and the response is divided into paragraphs that support the report’s structure. Some sentences communicate the intended figures clearly, such as “Lowest library users are academic staffs which is 7%.” However, errors in articles, agreement, sentence construction, and punctuation occur across the response. Examples include “an university library's users categories,” “helpfulness of staff get,” and “95% users are very satisfied,” while “In addition library openings hours are comprise” has a faulty verb structure. The sentence beginning “44% of user” also combines two competing constructions. Build accuracy by using straightforward patterns such as “X accounts for Y%” and “Y% of users were satisfied,” then check articles, plural forms, and sentence boundaries.
See this exact question answered at other band scores. The same prompt compared across bands.
Browse more IELTS Writing model answers or get your own writing scored by the same AI examiner.