Band 5.0 IELTS Writing Task 1 Model Answer
Overall Band Score: 5.0 · Cambridge IELTS 17 · 2026-11-11
IELTS Writing Task 1 question
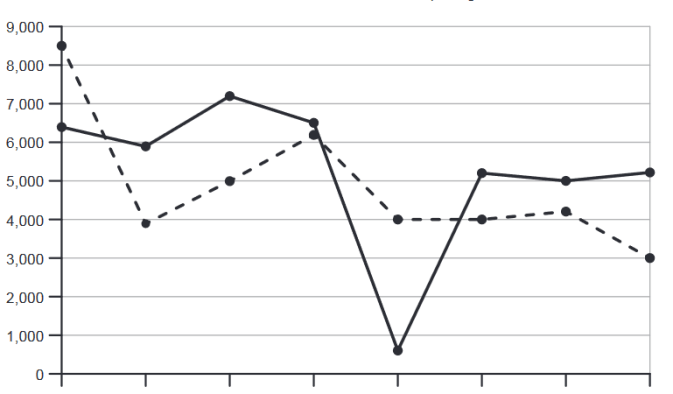
The graph below shows the number of shops that closed and the number of new shops that opened in one country between 2011 and 2018.
Summarise the information by selecting and reporting the main features, and make comparisons where relevant.
Number of shop closures and openings 2011– 2018
Student answer (Band 5.0)
This graph shows the number of shops that closed and the number of new shops that opened in one country between 8 consecutive years starting from 2011. In 2011, the maximum number od shops were closed. Most number of new shops were opened in 2013 while least is in 2015. The number of shops that closed in years 2012, 2015 and 2016 is almost the same. The minimum shops that were closed is in the year 2018. In almost every year the number of shops that are closed is lesser than the number of new shops that opened. There are 2 exceptions in 2011 and 2015. During the first 2 years, the number of shops closed and new shops opened both has decreased. In year 2015 it has decreased gradually.
By observing this graph, I assume that in the early 4 years there were a new demand for new shops than the rest of the years.
AI examiner evaluation
| Criterion | Band |
|---|---|
| Task Achievement / Task Response | 4.5 |
| Coherence and Cohesion | 5.0 |
| Lexical Resource | 5.0 |
| Grammatical Range and Accuracy | 5.5 |
| Overall | 5.0 |
Task Achievement / Task Response: Band 4.5
You identify the subject and period, and you attempt to compare openings with closures. However, several key details are inaccurate: closures peaked in 2013, not 2011; openings peaked in 2011, not 2013, and their lowest point was 2018, not 2015. Closures reached their minimum in 2015, rather than 2018, and the two series were not lower or higher in the way your general comparison suggests. The claim that both figures decreased during the first two years is also incorrect for openings after 2012. The final explanation about demand is speculative and not supported by the graph. The response is 137 words, below the required 150, and 19 words copied from the prompt were not counted. Select the main trends accurately and support them with figures.
Coherence and Cohesion: Band 5.0
The response follows a broadly understandable order: it introduces the graph, lists observations, and ends with an interpretation. Some comparisons, such as discussing the first two years, give the reader a sense of sequence. However, the ideas are presented as a series of short statements rather than grouped into a clear overview and logically organised detail. The repeated references to individual years do not build a consistent account of the two trends, and the final sentence shifts to an unsupported explanation. Linking phrases such as “During the first 2 years” help, but connections between claims are sometimes unclear. Use separate paragraphs for an overview and the main details, and organise comparisons by trend or period.
Lexical Resource: Band 5.0
You use relevant basic terms such as “shops,” “closed,” “opened,” “maximum,” and “minimum,” so the topic is generally clear. There is some attempt to vary expression with phrases such as “By observing this graph.” However, the range is limited and several word choices or collocations are inaccurate or awkward, including “Most number of new shops,” “least is in 2015,” and “a new demand for new shops.” The spelling error “od” also affects accuracy. Aim for precise trend language and natural comparative phrases, for example, “the highest number of openings” and “the figure fell to its lowest point.” Avoid repeating “number of shops” when “the figure” or “the total” is clear.
Grammatical Range and Accuracy: Band 5.5
Your sentences communicate the general topic, and you attempt some longer structures, including “In almost every year the number of shops that are closed is lesser than the number of new shops that opened.” Most of the response, however, relies on simple sentence patterns, and errors in agreement, articles, and verb forms recur. For example, “both has decreased” should use a plural verb, while “there were a new demand” has incorrect agreement and article use. “The number … is almost the same” also needs a clearer grammatical construction when referring to several years. These errors do not usually prevent understanding, but they make the account less controlled. Practise accurate past-tense reporting and vary sentence structures while checking subject–verb agreement.
See this exact question answered at other band scores. The same prompt compared across bands.
Browse more IELTS Writing model answers or get your own writing scored by the same AI examiner.