Band 5.5 IELTS Writing Task 1 Model Answer
Overall Band Score: 5.5 · Cambridge IELTS 17 · 2026-11-12
IELTS Writing Task 1 question
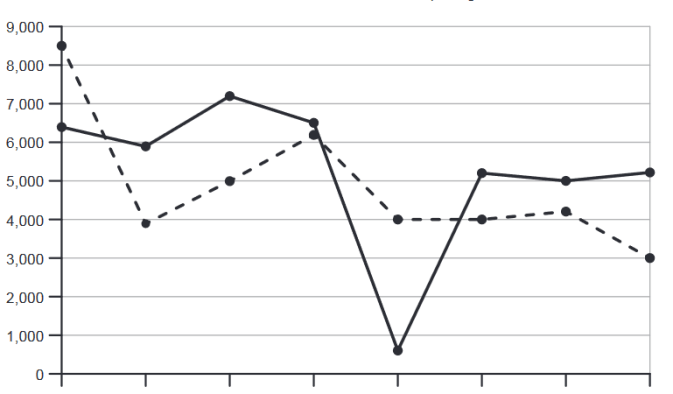
The graph below shows the number of shops that closed and the number of new shops that opened in one country between 2011 and 2018.
Summarise the information by selecting and reporting the main features, and make comparisons where relevant.
Number of shop closures and openings 2011– 2018
Student answer (Band 5.5)
The line graph illustrates the number of shop closures and openings in one country between [redacted phone]. The year 2011 shows the highest number of shops opened between the entire tenure of 2011 and 2018. However, 3000 new shops were opened in 2018, being the lowest number between 2011 and 2018.
The number of shop closures and openings appear to be similiar in year 2014 that was 6000. Moreover , 2016 and 2017 almost reported the same number of shop closures and openings, almost 4000 shops were newly opened while 5000 were closed. 2013 reports the highest number of shops being closed that was almost 7100 while, the least number of shops closed were in 2015.
A similar number of shops almost 4000 newly opened in 2012,2015,2016 and 2017 with a slight increase by 100 shops in 2017. 2011 and 2012 reported the equivalent amount of shop closures.Eventually, the same difference of shop closures and openings was reported in 2011 and 2012.
AI examiner evaluation
| Criterion | Band |
|---|---|
| Task Achievement / Task Response | 5.0 |
| Coherence and Cohesion | 5.0 |
| Lexical Resource | 6.0 |
| Grammatical Range and Accuracy | 5.5 |
| Overall | 5.5 |
Task Achievement / Task Response: Band 5.0
You identify several relevant features, including the peak in openings in 2011, the low point in 2018, and the sharp fall in closures in 2015. However, the response only partly summarises the graph: it has no clear overview of the contrasting overall patterns, and some comparisons are inaccurate or unclear. For example, closures and openings were not both about 6,000 in 2014 (approximately 6,500 and 6,200), and the claim that 2011 and 2012 had equivalent closures is incorrect (about 6,400 and 5,900). The 2015 closure figure is also not stated, despite being a major feature. Select the main trends, report key figures accurately, and avoid unsupported claims such as the “same difference” in 2011 and 2012.
Coherence and Cohesion: Band 5.0
The response is divided into paragraphs and generally groups related information, so the reader can follow its broad subject. However, there is no clear overall progression from an overview to organised comparisons. The opening paragraph focuses on openings, while later paragraphs move between years and categories, and the final sentence repeats an unclear comparison rather than concluding the summary. Linking words such as “However,” “Moreover,” and “Eventually” are used, but some do not express the relationship between the ideas accurately. Organise the report around the main trends—for example, openings first and closures second—and use clear comparisons between corresponding years. This would make the progression more logical and reduce repetition.
Lexical Resource: Band 6.0
You use an adequate range of vocabulary for describing the graph, including “highest number,” “lowest number,” “slight increase,” and “difference.” These choices help communicate the main subject, and the reader can generally understand your comparisons. However, some expressions are imprecise or unnatural for data reporting, such as “entire tenure,” “reported the equivalent amount,” and “same difference … was reported.” There is also a spelling error in “similiar.” Prefer concise, conventional chart language and use terms such as “rose,” “fell,” “remained stable,” and “approximately” where appropriate. More precise wording would help distinguish the number of shops opened from the number of closures and make your comparisons easier to interpret.
Grammatical Range and Accuracy: Band 5.5
You attempt a mixture of simple and more complex sentences, including clauses beginning with “while” and “that,” and most of the intended meaning remains understandable. Some grammatical errors nevertheless affect clarity. For example, “The number … appear” has a subject–verb agreement problem, while “2013 reports the highest number … that was almost 7100” uses an awkward tense and clause structure. Punctuation is also inconsistent, as in “Moreover ,” and the missing spaces after commas in year lists. Use past-tense verbs consistently when describing the completed period, check singular subjects such as “the number,” and punctuate clauses and lists carefully. These changes would improve accuracy while preserving your attempts at varied sentence forms.
See this exact question answered at other band scores. The same prompt compared across bands.
Browse more IELTS Writing model answers or get your own writing scored by the same AI examiner.