Band 5.0 IELTS Writing Task 1 Model Answer
Overall Band Score: 5.0 · Cambridge IELTS 17 · 2026-11-18
IELTS Writing Task 1 question
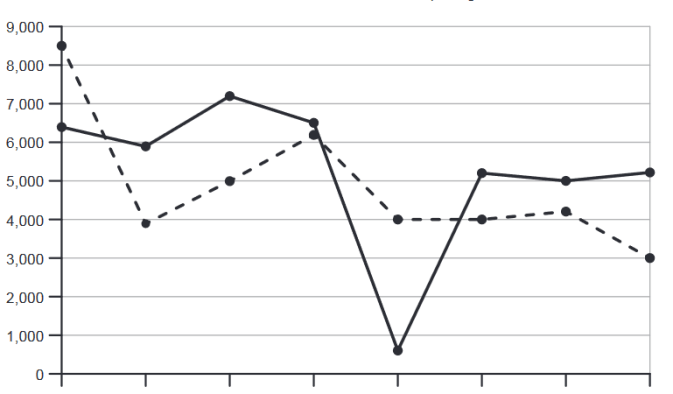
The graph below shows the number of shops that closed and the number of new shops that opened in one country between 2011 and 2018.
Summarise the information by selecting and reporting the main features, and make comparisons where relevant.
Number of shop closures and openings 2011– 2018
Student answer (Band 5.0)
The graph illustrates the number of shops that closed in the past and the number of shops new opened in one country between 2011 to 2018.
Overall, It can be clearly seen from the graph the numbre of shops opened is more than the numbre of shops closed , But there is one period the numbre of shops closed more than number the shops opened.
Firstly, It is visible that the numbre of shops closed in the furst years is 8500 shops in 1 years it declined to 4000 shops closed and in two years after that it augmente to 6000 shops closed ,After that it diminuet to 3000 shops closed .
In terms of shops opened in 2011 , 6500 shops opened it declined with 500 in one years. after that it augmente into 7000 shops in 2012 than it diminuet with 500 sops in one years in the next years an enexpected decline with 6000 shops closed after that .
AI examiner evaluation
| Criterion | Band |
|---|---|
| Task Achievement / Task Response | 4.0 |
| Coherence and Cohesion | 5.5 |
| Lexical Resource | 5.0 |
| Grammatical Range and Accuracy | 5.0 |
| Overall | 5.0 |
Task Achievement / Task Response: Band 4.0
The response attempts to describe both shop closures and openings and includes an overview, but the main features are not reported accurately enough. The overview claims openings were generally higher, whereas closures exceeded openings in several years, including 2012 and 2016–2018. The figures and trends are also substantially confused: 8,500 is the opening figure for 2011, not closures; closures fell sharply to about 600 in 2015, not 3,000; and the account of openings assigns values to the wrong years and describes a 6,000-shop decline that is not supported by the chart. As a result, the response addresses the task only minimally. To improve, identify the major movements accurately, compare the two series, and give a concise overview grounded in the data.
Coherence and Cohesion: Band 5.5
There is some organisation: an introduction and overview are followed by separate sections beginning “Firstly” and “In terms of shops opened.” These markers help the reader recognise the intended structure. However, progression within the body is difficult to follow because years and figures are mixed up, and the final sentence trails off without clearly completing the comparison. Linking phrases such as “after that” are repeated and do not always make the sequence clear. The overview also conflicts with the details that follow. Use one paragraph for closures and one for openings, move through the years in order, and use precise references such as “in 2015” and “by 2018” so the reader can track each series.
Lexical Resource: Band 5.0
The vocabulary is basic and repetitive, with “shops,” “declined,” and “after that” used repeatedly. Some attempts at trend language, including “augmente” and “diminuet,” show an effort to describe change, but these forms are inaccurate and make the meaning harder to understand. There are also spelling errors such as “numbre,” “furst,” and “sops,” alongside awkward phrases such as “shops new opened” and “in one years.” These issues limit precision when reporting data. Build a small, accurate range of chart vocabulary—such as “rose,” “fell,” “reached a low,” and “remained stable”—and use standard forms like “the number of shops that opened.”
Grammatical Range and Accuracy: Band 5.0
The response uses some simple sentences and attempts longer structures, for example, “In terms of shops opened in 2011, 6500 shops opened it declined with 500 in one years.” However, the longer sentences are often faulty, and frequent errors in articles, agreement, tense, and sentence boundaries make relationships between ideas unclear. Examples include “between 2011 to 2018,” “the number of shops opened is more,” and the run-on sequence beginning “After that it augmente.” Capitalisation and punctuation are also inconsistent, as in “Overall, It” and the long final sentence. Practise accurate past-tense reporting and separate each trend into a complete sentence, using commas and full stops to show the sequence clearly.
See this exact question answered at other band scores. The same prompt compared across bands.
Browse more IELTS Writing model answers or get your own writing scored by the same AI examiner.