Band 6.5 IELTS Writing Task 1 Model Answer
Overall Band Score: 6.5 · Cambridge IELTS 13 · 2026-11-05
IELTS Writing Task 1 question
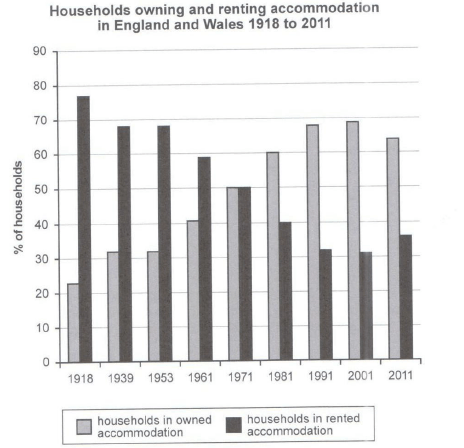
The chart below shows the percentage of households in owned and rented accommodation in England and Wales between 1918 and 2011.
Summarize the information by selecting and reporting the main features and make comparisons where relevant.
Student answer (Band 6.5)
The bar chart illustrares the proportion of household that owned or rented their home in England and Wales between 1918 to 2011.
Overview, the percentage of home which is owned increased considerably over the peiod but slightly decreased in the last year while, the rented part of accomodation significantly exprienced decrease however its simply increaesd in 2011 in over the period.
Looking at the figures in greater details,In 1918, approximately 22% of households owned their homes, copared with 78% who rented their accomodation.The proportion of homeowners than rose gradually to about 32% in 1939 and 1953,before increasing to approximately 42% in 1961.By 1971, the figures for home ownership and renting had become equal, at 50% each.
Turning to the other figures, in 1981 onowards, home ownership continued to increase, reaching around 60% in 1981 and approximately 68% in 1991. It peaked at about 69% in 2001, before falling slightly to 64% in 2011. In contrast, the proportion of rented households declined to around 31% in 2001,followed by a modest increase to approximately 36% in the final year.
AI examiner evaluation
| Criterion | Band |
|---|---|
| Task Achievement / Task Response | 7.0 |
| Coherence and Cohesion | 7.0 |
| Lexical Resource | 6.0 |
| Grammatical Range and Accuracy | 5.5 |
| Overall | 6.5 |
Task Achievement / Task Response: Band 7.0
You identify the chart’s subject and give a clear overview of the main pattern: ownership rises over time, while renting generally falls, with both reversing slightly in 2011. The key comparison at 1971, when the figures meet at 50%, is also included, and the later peak in ownership is accurately reported. Most figures are close to the chart, including the starting proportions and the 2001 and 2011 values. This covers the task well and supports the overview with relevant data. To make the account more precise, clarify that ownership was broadly unchanged between 1939 and 1953, rather than describing this stage only as a gradual rise, and state more directly that renting was the majority arrangement until the two figures converged.
Coherence and Cohesion: Band 7.0
The response is organised into an introduction, an overview and two detail paragraphs, and the progression from the earlier years to the later period is easy to follow. Phrases such as “Looking at the figures” and “Turning to the other figures” help signal the shift between sections, while “In contrast” appropriately introduces the opposite trend. The paired discussion of ownership and renting also makes the comparisons clear. Some linking is less controlled: the overview’s “while” and “however” create a crowded sentence, and the final paragraph reports the rented figures without first giving its 1981 value. Use simpler transitions and keep the two series aligned at key dates to make the progression more consistently smooth.
Lexical Resource: Band 6.0
You use an adequate range of task-related vocabulary, including “proportion,” “peaked,” “declined,” “modest increase” and “approximately.” These choices help describe trends and comparisons, and the meaning remains clear despite some inaccurate or awkward expressions. For example, “the rented part of accommodation” and “the percentage of home which is owned” are not natural ways to describe the data; “the proportion of households renting” and “home-ownership rate” would be more precise. There are also spelling errors such as “illustrares,” “peiod” and “accomodation,” which reduce accuracy. Aim for consistent, natural collocations and proofread spelling, especially in the overview, where precise wording matters most.
Grammatical Range and Accuracy: Band 5.5
You attempt a mix of sentence forms, including comparisons and clauses with “before” and “while,” and several sentences communicate the figures clearly. However, some grammatical errors remain, particularly in the overview and opening sentence. “The bar chart … between 1918 to 2011” has an incorrect preposition pattern; use “from 1918 to 2011” or “between 1918 and 2011.” The overview begins with the fragment “Overview,” and the clause “the rented part … significantly experienced decrease” lacks a well-formed article and structure. Punctuation is also inconsistent, with missing spaces after commas and an unnecessary comma before “while.” Practise complete, controlled overview sentences and check articles, agreement and punctuation.
See this exact question answered at other band scores. The same prompt compared across bands.
Browse more IELTS Writing model answers or get your own writing scored by the same AI examiner.