Band 6.0 IELTS Writing Task 1 Model Answer
Overall Band Score: 6.0 · Cambridge IELTS 13 · 2026-11-06
IELTS Writing Task 1 question
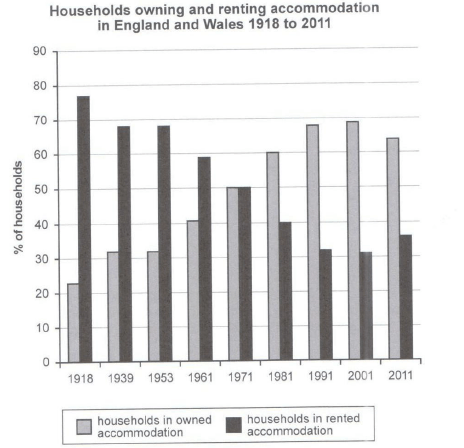
The chart below shows the percentage of households in owned and rented accommodation in England and Wales between 1918 and 2011.
Summarize the information by selecting and reporting the main features and make comparisons where relevant.
Student answer (Band 6.0)
The bar chart represent the percentage of households owning and renting accommodation in England and Wales from 1918 to 2011.
Overall, it is clear that home ownership increased considerably over the period, while the proportions of households renting accommodation experienced downfall trend. Initially, both figures were equal in 1971.
Beginning in the 1918, the home ownership are around approximately 22%, whereas household renting experienced vast majority to roughly 80% of people lives in the accommodation. However, in 1939 the home ownership accounted 30% and the renting figure was drop to around 70% and in 1953 the both figures are same. Therefore, in 1961 home ownerships jump to 40% and the household renting drops to 60% respectively.
In contrast, the year of 1971, both categories accounted for exactly 50% oh household. After this point, the percentage of home owners continue to rise and reaching its peak 70% in 2001 and the proportion of household renting are 30% the trends downfall continues. Consequently, in 2011 household renting figure increase 5% and the home ownership are same as well.
AI examiner evaluation
| Criterion | Band |
|---|---|
| Task Achievement / Task Response | 6.5 |
| Coherence and Cohesion | 6.5 |
| Lexical Resource | 5.5 |
| Grammatical Range and Accuracy | 5.5 |
| Overall | 6.0 |
Task Achievement / Task Response: Band 6.5
You identify the chart’s subject and give a clear overview of the main opposing trends: ownership rises overall while renting declines, and the two meet in 1971. Most reported figures are close to the chart, including the early values and the 2001 peak. This covers the task well, though some details are unclear or inaccurate. In particular, the 1953 figures are both about 32%, not the point at which they are the same as the 1971 figures; they are equal at both dates. The final statement that ownership is “same as well” does not explain that it falls from about 69% to 64%, while renting rises from 31% to 36%. Clarifying these later changes and using precise comparisons would make the report more complete and developed.
Coherence and Cohesion: Band 6.5
The response has a recognisable structure: an introduction, an overview, and two paragraphs describing the earlier and later years. The chronology is generally easy to follow, and transitions such as “After this point” and “In contrast” help signal changes. However, some links are mechanical or do not express the relationship accurately. “Therefore” before the 1961 figures does not show a clear consequence, and “In contrast” introduces the 1971 equality rather than a contrast. The final paragraph also combines the 2001 peak with the 2011 reversal without clearly separating those stages. Use transitions that match the data relationship and make the 2011 comparison a distinct, explicit point to strengthen progression and cohesion.
Lexical Resource: Band 5.5
You use relevant chart vocabulary, including “percentage,” “accounted for,” “proportion,” and “peak,” and the reader can generally understand the trends you describe. There is also some attempt to vary wording for the two categories. However, several choices and collocations are noticeably inaccurate or unnatural, such as “experienced downfall trend,” “vast majority,” and “the trends downfall continues.” “Vast majority” is also imprecise for a chart describing household percentages. Some repetition of “figure” and “household” limits flexibility. Aim for standard, precise language for describing data, such as “declined steadily,” “accounted for,” and “reached a peak,” and check that each expression fits the meaning you intend.
Grammatical Range and Accuracy: Band 5.5
You attempt a mix of simple statements and longer sentences, and the overall meaning is usually recoverable. However, errors in agreement, verb forms, articles, and sentence construction occur across the response. For example, “The bar chart represent” needs a singular verb, while “the home ownership are” has a subject–verb mismatch. In “the renting figure was drop,” the verb form is incorrect, and “in the 1918” uses an unnecessary article. The final sentence, “the home ownership are same as well,” is also grammatically unclear. These errors sometimes make relationships harder to follow, despite the clear overall message. Practise accurate present-tense descriptions and check each sentence for a clear subject, correctly formed verb, and appropriate article.
See this exact question answered at other band scores. The same prompt compared across bands.
Browse more IELTS Writing model answers or get your own writing scored by the same AI examiner.