Band 5.5 IELTS Writing Task 1 Model Answer
Overall Band Score: 5.5 · Cambridge IELTS 13 · 2026-11-08
IELTS Writing Task 1 question
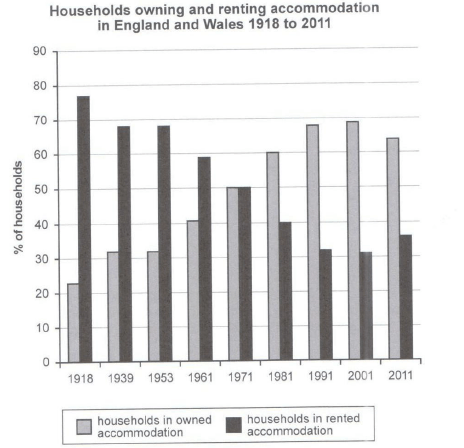
The chart below shows the percentage of households in owned and rented accommodation in England and Wales between 1918 and 2011.
Summarize the information by selecting and reporting the main features and make comparisons where relevant.
Student answer (Band 5.5)
The chart ilustrates the percentage of households in owned and rented accommodation in England and Wales in 1918 and 2011.
From an overall perspective, till 1918 most people live in rented houses and very few ones own a home after several decades it changed and in 2001 the number of owned households jumped.
To begin with, In 1918 there are only 22-23% peoples owned a house which is the lowest ones from the all the years and around 88% people lives on rental properties. But after 20 decades the changes can be seen that the reduction in rented accommodation which declined to 68% and increment in owned house approx 22% in 1939. Till 1953 there has been no change it remain constant. While, in 1961 there can be seen reduction in rented ones which comes to 58% and increased in owning home around 40%.
Furthermore, In 1981 the turning point is in owned households overtakes and mark around 60% and rented decreased to 40%. In addition 1991 and 2001 had same pattern in both categories with 68% in owned householdss and 30-31% in rented. In final year 2011 the number of owned ones reduced to 65% and increment in rented accommodation nearly 38%.
AI examiner evaluation
| Criterion | Band |
|---|---|
| Task Achievement / Task Response | 6.0 |
| Coherence and Cohesion | 5.5 |
| Lexical Resource | 5.5 |
| Grammatical Range and Accuracy | 5.0 |
| Overall | 5.5 |
Task Achievement / Task Response: Band 6.0
You cover the main pattern: ownership rises over time while renting falls, the two reach parity in 1971, and ownership then dips slightly by 2011. You also include several relevant figures, such as 60% ownership in 1981 and about 68–69% in 1991 and 2001. However, the overview is unclear and partly inaccurate: “till 1918” should refer to the period beginning in 1918, and ownership did not “jump” in 2001; it was almost unchanged from 1991. Some figures are also misreported: ownership in 1939 was about 32%, not 22%, and renting in 1918 was about 77%, not 88%. Make the overview more precise and check comparisons against the chart.
Coherence and Cohesion: Band 5.5
The response has a recognisable structure, with an introduction, an overview and two detail paragraphs. The chronological grouping helps readers follow the changes, and transitions such as “Furthermore” and “In addition” signal movement through the years. However, progression is not always clear because the overview’s “till 1918” and “after several decades” do not accurately establish the time periods. Some linking is mechanical, and the final paragraph moves from 1981 through 2011 without clearly distinguishing the peak from the later decline. Use a concise overview to state the major trend and crossover, then group the figures into earlier and later periods with clearer comparisons.
Lexical Resource: Band 5.5
You use relevant topic vocabulary, including “owned and rented accommodation,” “declined,” “increased,” and “turning point,” so the main information is generally understandable. There are also attempts to vary expressions for the two categories. However, several choices are inaccurate or unnatural, such as “the number of owned households jumped,” “22% peoples owned a house,” and “lives on rental properties.” Spelling errors such as “ilustrates” and “householdss” also reduce control. Aim for precise chart language and consistent collocations, for example, “the proportion of households that owned their homes rose” and “the share living in rented accommodation fell.”
Grammatical Range and Accuracy: Band 5.0
You attempt both simple and more complex sentences, including comparisons across years and clauses beginning with “which” and “while.” The overall meaning can usually be followed, but errors in tense, agreement, articles and sentence construction are evident. For example, “most people live” should be “most people lived,” while “there are only 22–23% peoples owned a house” needs a different structure, such as “only 22–23% of households owned a house.” The sentence beginning “after 20 decades” is also difficult to control, and several sentence openings have unnecessary capitals after commas or full stops. Practise accurate past-tense reporting and build comparisons in complete, well-punctuated sentences.
See this exact question answered at other band scores. The same prompt compared across bands.
Browse more IELTS Writing model answers or get your own writing scored by the same AI examiner.