Band 5.0 IELTS Writing Task 1 Model Answer
Overall Band Score: 5.0 · Cambridge IELTS 13 · 2026-11-10
IELTS Writing Task 1 question
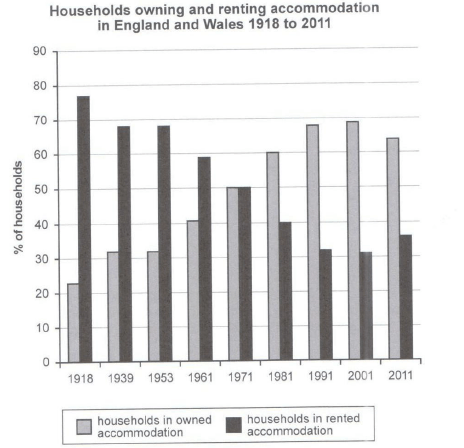
The chart below shows the percentage of households in owned and rented accommodation in England and Wales between 1918 and 2011.
Summarize the information by selecting and reporting the main features and make comparisons where relevant.
Student answer (Band 5.0)
The given bar chart elucidates information about households owing and renting accommodation in england and wales 1918 to 2011 . The chart compare different categories presents the data in numbers and percentages . Overall , it is clear that , there are noticeable difference shows among the categories shown in the chart , Households in rented accommodation is apear to be highest while , households in owned accommodation opposite of it . In addition , some categories shows some fluctuation by increment as well as decrement whereas some cases remain stable . According to the chart , 22% households in owned accommodation in 1918 and 78% households in rented accommodation in 1918 . Furthermore , Households owned accommodation in 1939 has value 31% and rented households 69% in 1939 . In addition , 1953 the owned households has 31% abd rented households has 69% . 1961 households owned and rented shows a figure 40% and 59% . After ten years the households owned and rented households staying close 50% and 50% . This shows clear camprison all activities . Slowly slowly owned households percentages highest rather than rented households . 1981 the households owned and rented has values 60% and 40% . In 1991 the owned households accommodation 68% and the rented households accommodation 31% . The hoseholds owned of figure 69% and 31% rented households . Lets have a look at the remaining information , Households in owned accommodation 63% and 37% rented households in 2011 . All the provided data suggests that there is no stability in all the activities .
AI examiner evaluation
| Criterion | Band |
|---|---|
| Task Achievement / Task Response | 5.5 |
| Coherence and Cohesion | 5.0 |
| Lexical Resource | 5.0 |
| Grammatical Range and Accuracy | 5.0 |
| Overall | 5.0 |
Task Achievement / Task Response: Band 5.5
You report the main direction of change and include figures across the period, including the near-equal shares in 1971 and the later rise in ownership. However, the overview is unclear and partly inaccurate: you say rented accommodation “is… highest,” although ownership becomes the larger category from 1981 onward, and the key crossover is not clearly summarised. Most figures are close to the chart, but the 2011 values are reversed in emphasis from the actual 64% owned and 36% rented, and the 2001 figures are not explicitly tied to that year. To strengthen the response, give a concise overview of the long-term opposing trends and identify when ownership overtakes renting, then select a few accurate comparisons to support it.
Coherence and Cohesion: Band 5.0
The response follows the years in chronological order and uses some linking expressions, such as “Furthermore,” “In addition,” and “After ten years,” so the reader can generally follow the sequence of data. However, there is no clear paragraph structure, and the overview is mixed with repeated year-by-year reporting rather than separated from the details. Several transitions are mechanical or confusing, including “This shows clear camprison all activities” and “Lets have a look at the remaining information.” The final statement that there is “no stability” also conflicts with the earlier mention of stable periods. Organise the answer into an introduction, a concise overview, and two detail paragraphs, grouping the early and later years to create clearer progression.
Lexical Resource: Band 5.0
You use some task-relevant vocabulary, including “owned accommodation,” “rented accommodation,” “percentages,” and “fluctuation,” and you attempt to describe change with “increment” and “decrement.” However, the range is limited and several choices or forms are inaccurate or unnatural, such as “households owing,” “categories presents the data in numbers,” and “Slowly slowly.” Spelling errors such as “apear,” “camprison,” and “hoseholds” are noticeable and can distract the reader. Repetition of “households” and “in addition” also limits flexibility. Practise precise chart language and collocations, for example “the proportion of households,” “rose steadily,” “remained unchanged,” and “fell slightly,” while checking spelling and word forms.
Grammatical Range and Accuracy: Band 5.0
You attempt both simple and more extended sentences, and the reader can usually identify the figures being compared. However, grammatical errors are frequent and sometimes make relationships unclear. Examples include “The chart compare,” “some categories shows,” and “households owned accommodation… has value,” where subject–verb agreement and sentence construction are faulty. Articles and prepositions are often missing or misplaced, as in “22% households” and “in 1953 the owned households.” Punctuation and capitalisation are also inconsistent, with spaces before commas and several sentence fragments or run-on sequences. Build accuracy first with clear comparative sentences, such as “In 1918, 23% of households owned their homes, compared with 77% that rented,” then vary structures once these patterns are secure.
See this exact question answered at other band scores. The same prompt compared across bands.
Browse more IELTS Writing model answers or get your own writing scored by the same AI examiner.